 Click on Chart to Enlarge
This chart is USO (oil) from the 2007-2008 bull market run into the final blow-off top where it over-threw the upper channel line before topping out.
 Click on Chart to Enlarge
This is gold over the same 2007-2008 time frame. Notice that it peaked in March of 2008 then rallied to a lower high at the July 2008 peak in oil. Silver looked very similar to gold here. The talk was "peak oil" in the news.
 Click on Chart to Enlarge
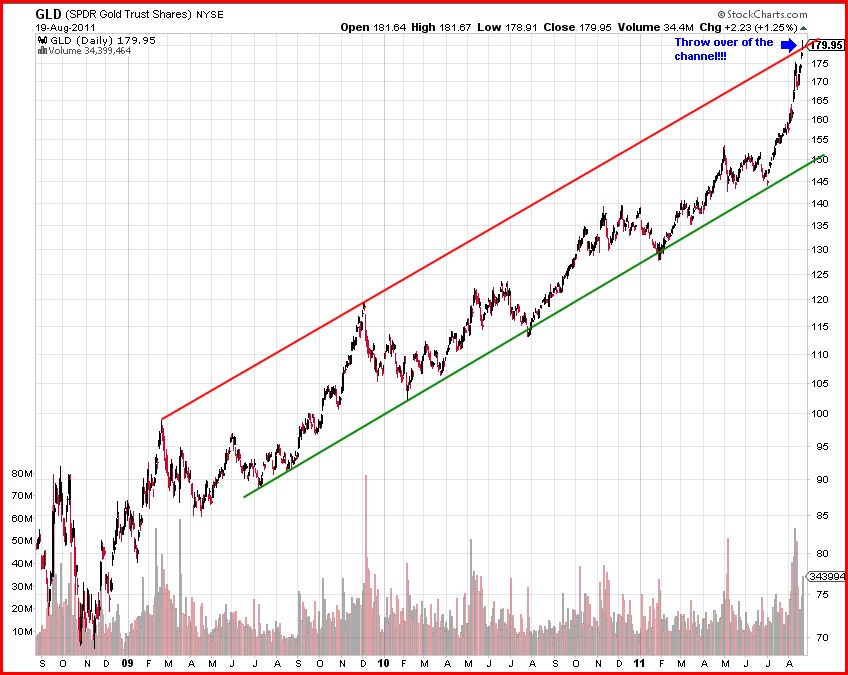
This is gold in the current bull market. Right now it is over-throwing the upper channel line of the current bull market. Look for it to either spike top here soon, or to start wedging and peak a few weeks down the road. Now the talk is inflation from debt monetization, etc.
 Click on Chart to Enlarge
The is silver in the current market. Notice it looks kind of like gold did relative to oil in 2008. It is not rallying to new bull market highs, but gold is. This is a non-confirmation between gold and silver right now and implies weakness ahead in silver, but also that gold is likely to be rising on borrowed time here.
One bigger difference in context here is that the overall commodity indexes are much weak here than they were relative to oil in 2008. So most markets have already topped leaving only gold flying to new highs. It is unlikely that one market will hold up the whole board....more likely that it's just a matter of days or weeks until gold tops and commodities come down harder and in more unison.
As a side note, I expect sideways to upward action in stocks early this week. Maybe a triangle forming or a downward flat finishing. The triangle implies several more days of sideways action while the flat implies a bottom forming quickly here and a sharp rally this week.
No comments:
Post a Comment