Tuesday, May 24, 2011

SPY Short-term Oversold at Gap Support

Click Chart to Enlarge

There is a large and yet unfilled gap up on SPY just below current levels. Given that the RSI(5) is oversold and we had some readings yesterdays suggestive of bottoming, I think it is most likely that we move up from these levels. I expect the gap to fill first. It could be used as a limit buy order with a stop below the April low. I may post a trade on it if prices fill the gap and then reverse higher.

Also there is an unfilled gap down from Monday which should attract prices soon.

Based on simple logic, the upward move was stronger at 9 days up, and at 16 days we have yet to retrace that move. This suggests the trend is still up and unless the April lows are broken, the high should be exceeded at least slightly.

AAPL Update - Watch the Leaders

Click on Chart to Enlarge

There are notes on the AAPL chart above. Basically this basing formation is showing heavy distribution relative to accumulation. So this base is probably failure prone and may signal that the broad market will correct. It actually looks like the market will try to bounce from here, AAPL included, but I would be very skeptical of any breakout buying on AAPL.

Click on Chart to Enlarge

Again further notes of this faulty basing structure.

As a side note. It is very important to note non-confirmations of the prevailing trend. If AAPL is a leading stock, why would it not make new highs with the market?

Also, if the tech sectors have been the strongest in this bull market, why are they not confirming the recent market highs relative to February highs?

Is the leadership of XLP, XLU, and XLV (consumer staples, utilities, and healthcare) a good sign for continuation of a major advance? Or is it a sign of psychology shifting to defensive mode?

Sunday, May 15, 2011

A Few Significant Divergences in Sentiment and Breadth


Click on Charts to Enlarge

The top chart shows that the equity put/call ratio has not been falling as stocks have made new highs. Looking back at prior instances, this often happens in a drawn out fashion at market turns

The lower chart shows the % of NYSE stocks above the 200 day MA. Notice that this hasn't reached new peaks relative to the February highs again showing some amount of divergence and waning breadth in the market.

The story looks similar in some other sentiment measures as well. And the smart money has been progressively getting more bearish in options trading. The OEX put/call open interest ratio is now at an extreme level last seen a few months before the 2007 bull market high.

Not that any of this means the market has to top right here. But there are signs that the current bull market is long in the tooth.

S&P 500 Update and a Few Patterns

Click on Charts to Enlarge

Notice the RSI on the SPY chart. The weekly RSI has become overbought and now has a nice bearish divergence. It also has the right "look" to me to lead to a top. If either of the dashed red trendlines break, then that could spell trouble for stocks. Also mid June is a time relationship that is intriguing for a large complex correction to complete based on the time of the previous sections. So we are nearing that time zone.

The CRB commodity index is in a similar position but has already had an explosive downward retracement of the last little wave up in less time than it took to form, indicating a change in trend to the down side for the intermediate term.

Treasury bonds look like they have a little left to rise at least. However, if/when QE2 ends in the coming weeks and the government buying of bonds subsides, that theoretically could leave some air underneath bond prices. I'll update that market as it unfolds. Things don't always go the way you think they would.

Bottom line right now, expect stocks and commodities to back off or get hit very hard in coming months, and expect a serious lift in the US Dollar. The technical analysis is confirming the sentiment on this now.

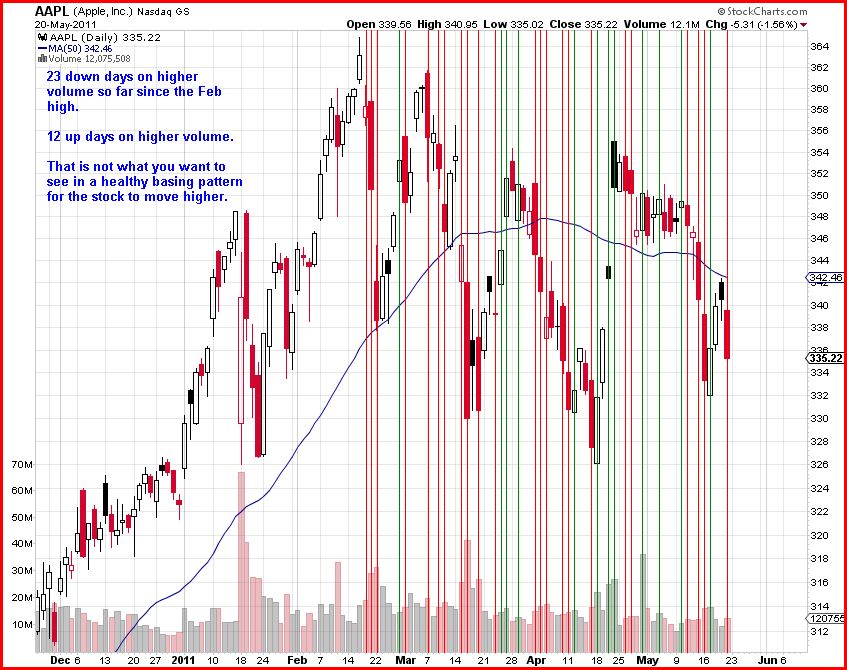
Below I am noting a few nice looking patterns on some stocks.

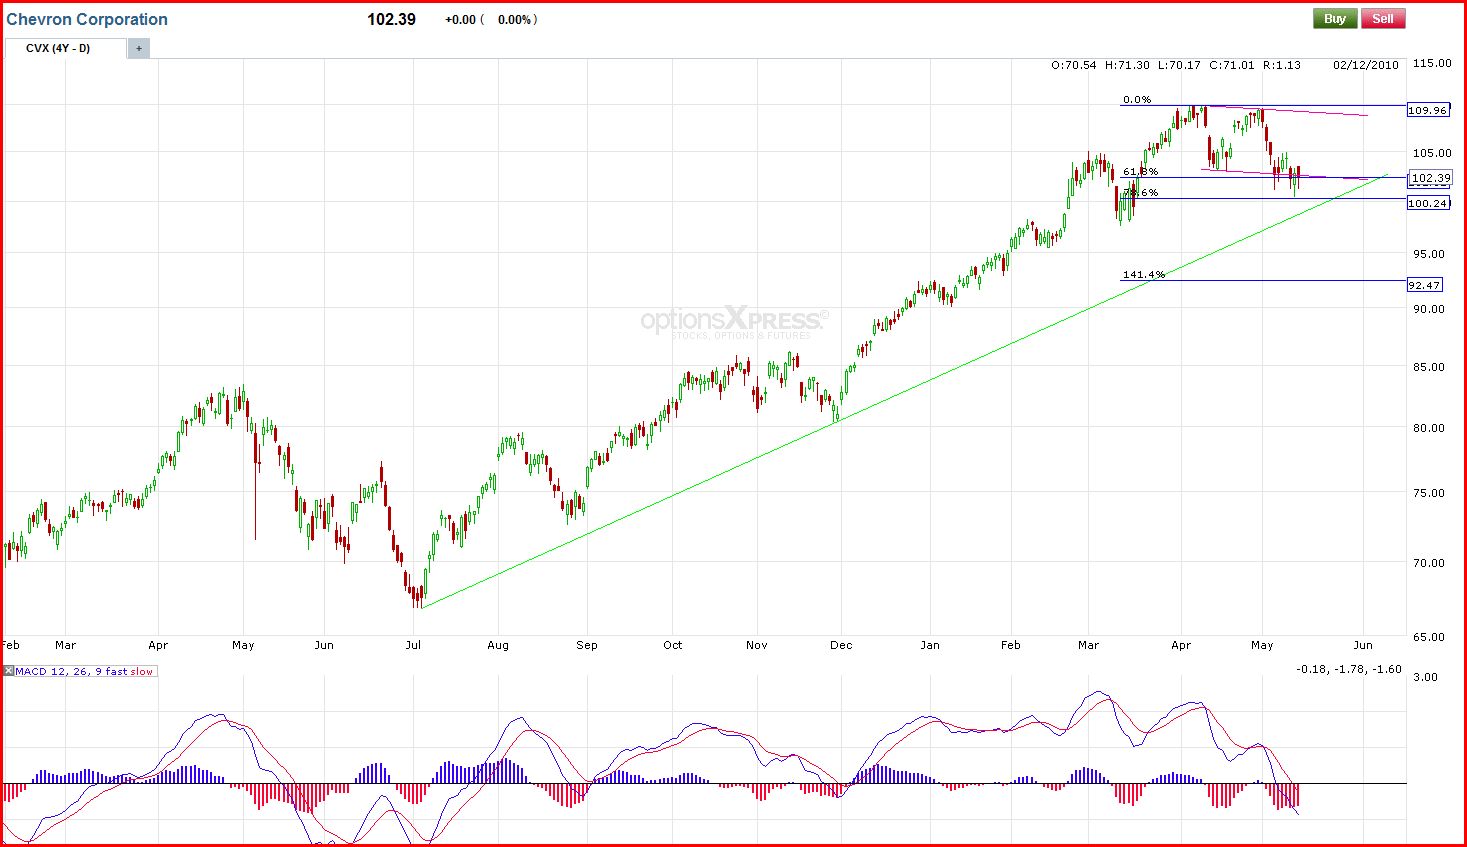
CVX showing a nice bullish set up on an ABC correction. Oil is at least short term oversold right now, and there are many oil related stocks showing similar patterns to this one. It looks like they have another push to new highs in them. If this pattern fails, then we probably have seen an important top.

MET failed to breakout of a large trading range and has now formed a nice upward ABC gartley pattern that could make a top here and move back down to the bottom of the range. Some other stocks in this sector look set to take a dive as well (AFL and HIG).

OSG looks like it may be making a long term bottom. It is just reversing off a tight resistance zone right now. If it breaks above the down trend line of the correction since 2010, then that would be a strong sign this is headed up in the long term.

Friday, May 13, 2011

More Signs that the US Dollar is Turning up and Commodities Down

Click on Chart to Enlarge

See the chart notes for an update on the US Dollar. Since it moves inversely to commodities, a major reversal should bring a serious correction on in commodities.

Your Feedback is Needed

Blogger had been having some problems the last couple days. I had made a couple posts detailing exits on SLV and DBA. I see now that blogger is back up and running the posts are not there.

Did those posts go out on the feed? Did anyone/everyone get those who needs them? If not I can make new similar posts. The price levels are not dramatically different at this point. Basically I recommended getting out of those.

I think DBA may continue lower, but I would rather exit here and wait for a break in the general commodity index before shorting again. Silver looks like it may be set for a rebound, but assuming commodities weaken, which I expect, I may suggest getting short again after a swing high and then a break to new corrective lows.

Thursday, May 12, 2011

Exit the DBA Short Trade

Exit the DBA short today with a market order. The current price is 32.25 which is small gain on the trade.

The hourly chart is showing a nice bullish divergence and is at support on the chart and is at a pattern based time reversal zone.

Exit the SLV Short Trade

Click on Chart to Enlarge

I am recommending exiting the short on SLV immediately today. There is a powerful bullish divergence on the hourly chart couple with a reversal from below a prior chart support. With the move being so dramatic and large, I think there may be some consolidation for a period even if the trend continues down.

Trade Action:

Exit the SLV trade today with a market order. The blog exit is 33.45 at the time of this posting

Friday, May 6, 2011

US Dollar Index Bottom Reversal

Click on Chart to Enlarge

See the chart above for the notes. It appears the US Dollar has made a significant bottom. The should co-incide with the end to the current bull market in commodities. Stocks should see pressure too, but I'm not confident to what degree.

I am targeting the Nov 2010 lows in cotton and silver as an exit level for those trades assuming the markets continue down. From all precedents I think the decline will be relatively steady and sharp. I don't expect a major secondary rally to a lower top on these.

Wednesday, May 4, 2011

SLV Update and DBA Entry

Click on Chart to Enlarge

The silver has provided strong confirmation that a significant high is in place. See the notes on the chart above. I would expect this to fall to 26 or maybe further. I would like to see a little rally and a swing high in silver then a break to new lows for the move in order to move the stop down.

The DBA short trade was triggered today as well. Hopefully this will provide quick follow through as well, though with a few days of weakness behind us, that is probably less likely.

Based on the CoT data, I think some of the commodity markets could be in for major declines. While it probably sounds absurd, I think the implied psychology of the data on crude oil would suggest that a move below the 2009 lows is probable in the next bear market in oil. So we may need to look at a short in oil in the future too.

I don't expect the stock market to be quite as weak as commodities, but it should weaken also. Expect a move up in the US Dollar index very soon. It looks like it is consolidating and finding an intermediate bottom at this level.

SLV Short Entry and New DBA Trade Order

The SLV trade was entered short at 43.00 with immediate further follow through to the downside. This is a great start to the trade. We should be able to move the stop down quickly to breakeven.

The grains look like they are also in position to start a large decline. So I will post a trade here to short DBA also. However, if short BAL and SLV then you may want to use a lesser risk amount than those, since they are all the same theme.

New Trade:

Place a GTC sell stop order to short DBA at 33.45. If filled place the buy stop to cover at 34.84.

The reward on the trade should be very good. I would project the decline to go 28.ooish on DBA.

Monday, May 2, 2011

Wide Range Weekly Doji in Silver/SLV

Click on Chart to Enlarge

The chart above shows a classic candlestick reversal pattern after a historically huge run up in silver. Today's gap down is reasonable confirmation to the idea that the doji was a top signal.

I will post a new trade here, short silver via the SLV ETF.

New Trade:

Place a GTC limit order to short SLV at 43.00. Place a stop at 48.50 immediately after entry and for purposes of calculating position size.

The reward potential on this trade is very good. I would typically risk about 2% of account value on a trade if stopped out.