Tuesday, August 26, 2014

Lowest Volume in SPY in Over 2 Years - More Topping Signs

Click on Chart to Enlarge

While it could be argued that we are in the summer doldrums and that is why volume is low, I don't know that it can rationalize the fact that SPY traded its lowest volume INCLUDING holiday trade, in over 2 years, except for Christmas Eve 2013.  Very interesting.  Seems like the market is just whispering...a couple very narrow range doji candlesticks right at new all time highs, and with the Dow 30 joining in today with another new all time high. 

This does not seem to me a good sign for bullish market action going forward.  Be warned here - in my opinion - that this market continues to display sign after sign of topping with divergences in every category of market analysis that I track - price, volume, put/call volume, volatility, breath.

This weekend's CoT report will be of interest in that both the S&P 500 and Dow 30 made new highs by today, and Friday's report will reflect data through today/Tuesday.  That report has not flagged any major smart money selling here recently, so it will be interesting to see how they respond to the new highs.  Of note though, as the lats bull market topped, the typical contrary nature of the CoT positions was not consistent, and so it would only be a possible confirming indicator to me of what is already obvious from my standpoint.....that stocks are likely very near to a significant high here.

PS - the chart above was posted shortly after close, and after volume numbers were finalized the reading changed.  The chart above showed that volume was the lowest in over 2 years, but the final number is a bit higher than Christmas eve 2013.

Monday, August 25, 2014

Lowest Non Holiday NYSE Volume in a Couple Years

Interestingly today, the S&P 500 made a new all time high, hit the round number mark of 2000, and SPY opened with a gap up, and yet the NYSE volume dropped to the lowest level in over 2 years - excluding holiday trade.  I'm sure that arguments can be made regarding what this means, but my opinion is that if buy programs are not kicking in here, then I kind of doubt that the market will hold up well at this level.

Click on Chart to Enlarge

This chart shows a 3 year history of daily New Highs - New Lows on the NYSE.  Of note here is that while we are at 2000 on the S&P 500 and new all time highs, the NH-NL is at a comparatively paltry 316.  The closest precedent I see on this chart is the first couple days of May 2012, in which the S&P 500 did NOT make a new high, but some indexes did, and the NH-NL topped right about where it is now and then stocks corrected about 10% the next 5 weeks.

So possibly we see some continued advance and the Dow makes a new all time high, and the Russell 2000 pushes higher and we see this number expands.  But currently, the reality is that stock averages are making higher highs with fewer stocks actually making higher highs.  This is classic topping action as far as I can tell.  Breadth deteriorates over a drawn out time frame, and finally the rally fizzles out.  Time will tell here, but I would look at this current market point as a significant resistance level that currently does not appear will be surmounted in the short term.

Today also formed a narrow range doji candlestick on SPY.  This could be an abandoned baby candlestick if stocks gap down tomorrow and move further to the downside.  For now, there is a quality shorting set-up on the hourly time frame from my perspective.


Sunday, August 24, 2014

Stock Market Internal Sentiment Update


Click on Charts to Enlarge

A couple days ago I had posted similar charts to these showing that while price was moving higher the last couple days, we were not seeing internal market indicators continue the same trend.

Above we see SPY with a MACD below where the MACD has fallen a bit as price moved higher.  There is nothing here that smacks of a significant reversal in my opinion, but it does look like a significant divergence is still forming on this time frame.  Given the daily and weekly time frame MACD indicators are in a bearish divergence, this shorter time frame signal may be of significance.

The NYSE Tick indicator on the hourly chart has also weakened the last several sessions.  A cross of the moving average below 0 could lead to some follow through to the downside.  Again this indicator is still suggesting that any higher highs from here without expanding breadth could be a continued divergence building.

The VIX on the hourly time frame is still well above the summer lows, maintaining the larger scale volatility divergence that is so consistently present at significant market turns.

The bottom chart is a daily chart of the total put/call ratio with a moving average and some deviation bands.  The current average is not below the lower band, but is close to it, suggesting that we keep alert for a move outside the lower band.  That would be a higher quality signal that the rally was near peaking.  Again of note here is that the moving average is well above its lows from the winter, but with prices now at new all time highs.  So again this could be viewed as a large scale bearish divergence with fear (in the forms of put trading action) increasing and forming a rising trend while prices are mustering some modestly higher highs.

So in summary here, I think that the major bullish run off the recent low is mostly done and we are more likely to experience more overlapping price action from here and possibly a significant top reversal process here around the 2000 level on the S&P 500.  It seems very likely to me that early this week price will move up to 2000 on the S&P 500.

Thursday, August 21, 2014

LB Puts


Click on Charts to Enlarge

Today I purchased a couple contracts of LB Sept 62.50 put options on LB, Limited Brands.  Typically I like to purchase a longer amount of time, but on this trade I am looking at a potentially competed rising wedge in LB, in conjunction with a short term overbought general market with some hourly time frame divergences.  I am setting a limit order of just over 100% gain to exit the trade, which may only take a 3-4% move down over the coming week.

I entered the trade in the afternoon for 0.95 per contract.  I am setting a limit order of 2.00 to exit, GTC.

The charts above are weekly, daily, and hourly.  The weekly stochastics is in the overbought position below the recent bull market high.  The daily stochastics is in the overbought position.  And the hourly momentum shows a bearish divergence between the current highs and the highs last week.

The chart pattern appears to be a rising wedge and contracting triangle.  The current move has over thrown the upper boundary of the wedge, and from a charting standpoint, this is the type of action often seen at the end of a pattern.

It is interesting to note the key points in the pattern.  In the current move up over the last month, the sales report came out and led to a gap up in the stock on 8-7-14.  Then today, earnings was released, and there was very mild movement to the upside in conjunction with the hourly chart divergence.  So it seems that the price driver to the upside has probably already occurred, and now the last weak move on earnings may be an exhaustion point.

Particularly with the broad market appearing to be on the verge of a consolidation or pullback for at least a few days, I believe this stock has the ability to decline back into the $60 region within the next few weeks.

This trade example is for learning purposes only.  And being an out of the money option trade, if the trade does not go as planned, it will result in 100% loss of capital.  So I have that factored into my trade size here.  I only purchased a couple contracts, and can stand to lose the whole amount within my money management plan.

Hourly Time Frame Bearish Divergences on SPY - The Current Rally Appears to Be Losing Steam


Click on Charts to Enlarge

These charts are hourly charts, the top one being SPY with a MACD study underneath.  We can see a nice directional advance the last 2 weeks, but now for the first time in the rally, the MACD is not confirming higher highs with price.  So on this short term time frame we are seeing the initial stages of loss of momentum and a potential top development.

The second chart down shows an hourly chart of the NYSE TICK Index, which is a short term measure of breadth in the market.  Again, we see here that the TICK peaked a couple days ago, and the last 2 days prices have been advancing with no increase in the TICK, and TICK currently at a lower peak.  Again, this is a sign that the real directional phase of this rally is waning.

The third chart down is SPY again with a volume and moving average of volume overlay.  Of note here is that the moving average of the volume is also rising to a lower peak and is showing divergence the last couple days.  The interpretation is basically the same, but the thing I find most interesting is that yesterday and again today SPY is hitting fresh all time highs.  And so if there is weakening volume on the breakout, then I question whether the trading algorithms are collectively going to buy the breakout to any substantial level if the first two days at new highs are not attracting larger volume and price movement.  

The bottom chart is the VIX an an hourly basis.  We do see the VIX hitting fresh lows today for the rally, but only modestly so, and in comparison to the VIX low in June and July, the VIX is at a higher level still having a longer term non-confirmation of the price trend at new highs.

So given what I have recently noted regarding the tendency in recent years for swift rebounds the first 2 weeks after a bottom with elevated equity put/call ratios above 1.0, all the above signs would indicate that we could be near the high of the initial rebound.  I don't expect a sharp topping process here, but let's continue to track this 2000 level on SPX for signs of longer term topping or reversal.

Tuesday, August 19, 2014

How Far Is This Current Stock Market Rally Likely to Go?

In a recent post I highlighted the rise in the equity put/call ratio to above 1.0 and suggested that we would see at least slightly lower lows followed by an inevitable swift rally with most of the gains in the first 2 weeks of the rally.

Well here we are now and it appears that so far things are playing out very much as suggested/expected.  Today will market the 8th day of the current rally off the 8-7-14 low.  And it definitely has been a swift and directional advance.  So now that we are in the time frame of where we may expect things to slow down or for a possible larger scale top to complete, let's look at some more details.....


This list shows all equity put/call readings greater than or equal to 1.0 since CBOE data available in 2003.  I had suggested that the Aug 2007 and June 2011 instances were the most technically similar in recent years with overbought and divergence conditions on the weekly time frame already being in place.

If we replicated the rally from June 2011 low to the July 2011 high, it would put SPY at about 204.00 this week to next week.  But again it may be more sensible to correct for volatility and to understand the tendency for final highs or secondary rallies to double top or fail to exceed an old top.  From a simple chart based standpoint as opposed to measuring in percent terms, the rally off Aug 2007 lows made a slightly higher high for the bull market, basically double topping then declining.  Off the June 2011 low, the rally was more brief and failed slightly below the prior high from May 2011.

So as we now see the QQQ at a new high, and the other indexes still lagging with concurrent divergences still present, I believe it is sensible to expect this move to stall near or slightly above the recent all time highs in SPY.

If prices decline below the recent low from Aug 7th, I think that would be a sign of broad market weakness.  So that could be a line in the sand to watch depending on your holdings and time frame.


Sunday, August 17, 2014

Multiple Time Frame MACD Bearish Divergence on QQQ Suggesting a Possible Bull Market Top

Multiple Time Frame MACD Bearish Divergence on QQQ Suggesting a Possible Bull Market Top

I have published a new technical analysis video covering the Nasdaq, VXN, banking stocks, and housing stocks in depth.  The trend channel and MACD technical analysis as well as broad scale index and sector non-confirmations suggest to me that a major top is indeed in process here in stocks.  That is my opinion anyway from an analysis standpoint.  As always, translating analysis into objective trading is another level, so simply use this info within an objective trading context.

Futures this evening are up, and it will be interesting to see this week whether there is a weekly top reversal candlestick in QQQ.  A gap up tomorrow/Monday followed by a significantly lower close on the week, would fit with the typical topping price patterns seen in markets.  If prices on QQQ this week close below last week's open @ 95.27 after a gap up tomorrow, that would be a weekly bearish engulfing pattern, and that would be a significant price bar given the technical analysis in my opinion.

97.94-98.35 would be the typical topping price range for QQQ given the hourly chart technical analysis in my opinion.  I personally have an order to purchase deep OTM puts on the SPY etf to take advantage of a possible top and sharp decline into the seasonally weak period of Sept-Oct in stocks.

Thursday, August 14, 2014

DBA Call Option and Technical Analysis

Click on Chart to Enlarge

This is an hourly chart of DBA, which is the PowerShares Agriculture fund.  I purchased some call options near the close of today's session.  I bought the Sept 26 calls for 0.50 a contract.  The spread was about 0.05 which is 10%, but given the possibility of a 100% + move in the options over the near term I settled for it.

The chart above shows a beautiful bullish divergence on the momentum as it hit today's lows.  But I would suggest looking at the multiple time frame set-up as well.  The daily MACD and momentum are showing classic bullish divergence as well between the two major lows visible on the chart above.  Additionally, the weekly stochastics is over sold and with some mild bullish divergence.  So it appear that today could be the trough of a potential multi time frame turn higher.

Looking at the last portion down of the chart above I have labeled a nice looking Elliott wave style 5 wave impulse.  So at this point given the obvious loss of momentum and the possible failed break below the July 11th low, it appears likely that we see at least a partial retracement of the last move down over the last couple weeks.  From looking at the daily chart, it seems that a move back up to the 27.00 level could be quite likely.

If prices do indeed rally here, and completely retrace the last two weeks downward move in LESS time than the decline took to form, I believe the logic would be that a new upward pattern was at play, and that we could probably expect prices to rally well above 27.00 in coming weeks.  The pink vertical lines show the current forward time projection as August 29th the date prices would need to move above 27.00 by in order to confirm this.

So given that possibility I just bought the Sept expiration calls anticipating a quick rally to 27.00, with possibly a move well above that.

My current exit plan is to simply maintain the option with no stop loss and am willing to hold until expiration even if it results in 100% loss.  That is factored into the amount risked/put into the trade.  I currently plan to exit half the contracts at 100% gain if prices rally modestly from here.  HOWEVER, if prices rally very swiftly (3-4 days) back above 27.00, then I will opt for holding all the contracts and use the daily chart as a possible exit indicator prior to expiration if a divergence develops.

So part of the logic is that a rapid retracement of this last decline would suggest a likely new pattern occurring, and with the 26 strike option, it would seems likely that the option would expire in the money and that the 26 level would be a significant support level.  And so I would like the opportunity to make a larger gain on the whole position if everything develops in ideal fashion.

Click on Chart to Enlarge

This chart is a daily chart with two projections up from this low that simply project the 2 prior significant rallies visible the chart up from today's low.  In both instances we see it would be likely that the option could expire in the money and probably make 100% gain along the way.  But if we see a significant rally even close to the green projection line, then a 400-500% gain on the option would be possible.  So while I don't EXPECT that, I want to plan for the scenario that makes the big money and maximize it by holding the whole position if price explode up from current levels indicating a possible intermediate low is in place.

Pete

FL Dual Time Frame Put Option Set-Up

Click on Chart to Enlarge

This is a daily chart of FL, Foot Locker.  Notice the daily stochastics in the overbought position at a lower high and the more time consuming and overlapping rally off the 7-17-14 low, in comparison to the prior decline off the high.  This creates a nice price logic set-up for a short sale or put option trade.  Now let's move down to an hourly chart to focus in on a trade entry for the set-up

Click on Chart to Enlarge

This hourly chart shows a recent momentum peak at the upper end of the recent range of the momentum indicator.  Now we are seeing price to push to higher highs, but the momentum indicator is reaching a lower peak.  The indicates a slowing down of the current action, with the distinct possibility the price will soon reverse to the downside.  So from this point, on a trading basis, an objective method is needed to enter, or simply enter during the divergence and place a stop above the resistance level which would be the highest point on the chart.

HOWEVER, the earnings release is next week, and so the potential exists for a significant gap or price movement.  So in this situation my reasoning is that making a trade just before earnings is essentially a gamble, and if the earnings moves the stock up rather than down as the technical analysis suggests to me here, then I basically have a coin flip in risk versus reward by shorting the stock.

But in terms of options, if price moves up and no significant decline materializes, the max loss is 100% of the option value, but if earnings comes out with a gap down and break of the recent July support, the option could very reasonably move 200-300% or even more over the next couple weeks.  So in this situation I am electing to try to purchase a put option as prices hit this resistance area, with the reasonable probability of a 3:1 reward versus risk on a Sept 50 put option.

I currently have an order to buy the put at a limit of 1.40.  The spread is about 0.20 on the option, and it appears that price would have to move another 20-30 cents up before the order would fill.

Please note that this is for education, and that you will lose 100% of the money in this trade if the trade is not successful.

SPY Call Option Exit

I exited the Aug 191 SPY call options completely at 4.25 and 4.40 respectively in half positions.

With only 1 day till expiration and a divergence on the 15 min momentum and a reversal bar at 11:00, I decided to exit the second half rather than hang on till tomorrow despite the obvious loss of momentum that can often last a day or more after a turn on the 15 min chart.

SPY Aug Call Options - Exit

Click Chart to Enlarge

This chart is a 15 min chart of SPY.  I have held a couple contracts of the Aug 191 calls on SPY based on the VIX and put/call extremes I have recently highlighted.

So now options expire tomorrow and so I am looking at fine tuning the exit.  What I show above is an external retracement of the decline from Monday to Tuesday as well as an external retracement of yesterday afternoon's mild pullback.  There is an overlap of a couple fibonacci levels at 195.35.

I have had a limit order to exit half the contracts at 4.25 which would roughly correspond with the 195.25 level on SPY.  So this short term analysis confirms that as a reasonable short-term target.

I have another limit order to exit closer to a fill of the gap at 196.98.  The limit order is for 5.40 which is about the middle of the gap down from 7/31/14.  That would not even take a 1% rise in SPY to achieve that level, so it is within reason that it could be hit within the next two trading sessions.

The set-up for taking a put or inverse trade is not yet developed, though as we move through expiration I will be keeping an eye on that possibility.

Of note here, while I don't have quantification of this idea, I have consistently noted a tendency in this bull market for prices to generally rise into options expiration, and to experience the most significant corrections following options expiration and into the 1st or 2nd week of the next month.  So, if this little rally here is a sucker rally in a larger scale correction, I would expect the move to the downside to pick up as this month ends and September begins.  Nothing magic here, just one of the cycle at play in the market that can fill out the picture of an otherwise appropriate technical set-up.

Wednesday, August 13, 2014

SPY Time Pattern Analysis and Logic

Click on Chart to Enlarge

The review of SPY tonight will rehash a little of what I have pointed out in recent posts, and also add a pattern concept.

First off, as suggested in the last post, the short-term price logic continues to confirm a bullish trend.  The up moves are directional, large and fast.  The intervening downward move was small and "slow".  And again with today's move higher, the intervening downward move was completely erased in less time than it took to develop from high to low.

So the next thing to look for here in terms of when the trend is potentially ending is to look for a divergence pattern to develop.  So in the chart above I show a momentum indicator.  If price makes a higher high, but the momentum fails to make higher highs, that would indicate a slowing down of the market, which is the typical pattern that precedes a reversal.

There is an unfilled gap down above prices, and it is highlighted on the chart.  Sizable gaps have a strong tendency to fill within a couple week time frame.  And so as we see prices rallying here, that gap is an obvious target of potential attraction for prices, and may also offer a potential point of chart resistance.

The pattern concept I want to point out here is that when two successive moves in a pattern are similar in time, the next move is typically longer.  As an ideal ratio the next move may take about the same time as the total time of the prior 2 moves together.  That is what the vertical lines are showing as a time projection on the chart above.  That would suggest we may see price move generally high until Friday.  From my pattern based research, a typical ABC pattern has a median C leg that takes a little less than the total time of A+B.  However the AVERAGE C leg, takes about 1.17 times the time of A+B.  In any case, I am simply offering the suggestion here, that even if this move up here is counter trend in a correction, we may still have a couple days up in the current portion of the move.

Pete

Tuesday, August 12, 2014

Short Term Price Logic on SPY

Click on Chart to Enlarge

This chart is a 15 min candlestick chart of SPY.  I am just following up here with the short term movements in SPY recently.  The last couple posts suggested that we would likely see SPY attempt a rebound given the short-term technical analysis and intermediate term extreme in put/call ratios and VIX.

So here we are a couple days into a rally and let's see what we may expect.  First off the rally off the recent low completely retraced the last wedging portion of the decline in far less time than the decline took to form.  That gives us a logical indication that the short-term psychology and trading algorithms turned bullish.

Next we now see that the decline off the peak of the initial thrust off the low, has been very small and has already taken as long as the rally from high to low.  So this is additional logical confirmation that the upward price action is still dominant and the downward moves are corrective on this short term analysis.

Based upon this, I would suggest that it is probable that we see a rally up above Monday;s high before this rally completes.  So at this point we have a price logic "set-up".  A very simple analysis and yet a powerful logical construct to apply to market action in order to gauge the dominant trend.  From this point for trading, I suggest having an objective indicator signal to give a trade entry and trade follow through as far as setting stops and moving stops.

Given the recent post about put/call ratios suggesting that the recent spike above 1.0 may be signs of a larger shift down, I think it would be wise to apply similar logic on any decline that rapidly retraces an upwards move.  If we see that type of action at a lower high than the recent all time highs, then it would offer a possible short position.

The last 3 daily sessions in SPY have occurred on lower volume.  That is arguably a sign of weakness.  And given the larger scale turn down off of divergences in the weekly MACD, etc, we should be keen to a potential sucker rally here.

I will track short-term moves over the next several sessions because of the possible longer term change in market character here and the potential to establish short or inverse positions on this rally.  As of the current time of writing, I would suggest that shorting on a break to a new corrective low may be a legitimate strategy here given the larger currents.  That type of play has generally not offered a good reward to risk ratio in this bull market, but with willingness to quickly adjust a stop toward breakeven it could offer a viable trade in my opinion.

Pete


Monday, August 11, 2014

Initial SPY Targets

On this rally SPY is nearing what I would consider the first profit taking targets based upon the hourly charts.

193.88 is a recent unfilled gap down, and it appears SPY will open near this level today.  Just above that level is minor swing high at 194.30.  I think it is likely that this 194.30 will be exceeded as a very minimum target on this move.

Above those levels, the unfilled gap down at 196.98 is the next chart based target from my perspective.

Friday, August 8, 2014

Interesting Overnight Action In Stock Futures

Click on Chart to Enlarge

The short term reversal signal I highlighted Wednesday, did not amount to much.  And yet the set-up remains here that there is divergence in sentiment (also divergence in short term price action/technicals) as prices are making lower lows.

Last night the futures ran down nearly a percent on a headline "negative" news item with US ordering air strikes on Iraq and further conflict news out of Europe.  But here we are in the morning with the overnight losses recovered and a possible hammer candlestick (at least as it appears now).

So stocks look set-up to actually make a small gap up today.  But given the over night lower lows in the futures and yesterday's weak close, I would suggest that we are likely to see price move below yesterday's session low after a gap opening, but with a reasonably good chance that a rally occurs after breaking yesterday's low in the cash session.

This set-up may be most useful for day traders, to try to time a bottom reversal off a 1 or 5 min chart, with the possibility of a rally to close in the upper end of the daily range.

Thursday, August 7, 2014

SPY Call Options and MS Put Exit

I exited the recent MS Sept 33 puts yesterday for a very small gain of about 6%.

Also I purchased SPY August 191 calls @ 2.60 yesterday afternoon.  Stop @ 1.80.  Based on the outlook from the recent posts I am anticipating a bounce in price to fill Tuesday's unfilled gap down at 193.88.  At this point is seems like price could easily rebound above that level.  There is an unfilled gap down at 196.98 from 7/31/14.  That would be the next price level that I think would be an ideal exit to the trade if prices do rebound strongly from this level.

Wednesday, August 6, 2014

Potential Bottom Reversal Today

Based off of today's price and sentiment action, my bottom picking system has noted this as a possible inflection point.  The current signal is only at a 2 month low, and I view it as somewhat less significant and reliable than signals that happen at 3 month lows or more.

When a signal like this occurs, I don't consider the signal to get confirmed unless the reversal day's high is exceeded.  So, a higher high tomorrow would be a potential buy signal.

The recent signals going back to the May 2011 high are listed in the picture below.  Not all signals were confirmed with a higher high, but if you want to look at a price chart to get a feel for where these signals show up, and what the reward to risk profiles have been, then these will give a decent start.


Most of those signals either market significant lows, or led to at least a short term (1 day or more) price rebound.  Again, these signals are not super high specificity, they are designed to be highly SENSITIVE, so that just about every significant market low in an uptrend will be flagged for a buy.

Click on Chart to Enlarge

This chart shows a graphical/quantitative picture of the indicator that is evaluated into the logical buy signals such as those above.  This gives a sense of the magnitude of panic in the market relative to past market action.  We see that currently the level is approximating the levels of market panic at most of the lows the last 2 years.  The June 2013 saw higher panic levels, and it also was of longer duration and greater magnitude than the other corrections shown on this chart.

So this is just an objective heads up that if stocks are to continue an uptrend, this would be a logical point for a potential reversal. If buying long, the stop would go below today's low.  An exit signal would be taken at an opposite statistical extreme, or a stop movement mechanism could be used if prices rally from here.

So don't necessarily take this as a trade.  But use it in your analysis for a potential long trade set-up.  And as always, the key is managing the trade in terms of stops and having a definitive/objective profit taking or securing method as the price action unfolds.

Pete

Tuesday, August 5, 2014

Recent Spike In Equity Put/Call Ratio Above 1.0

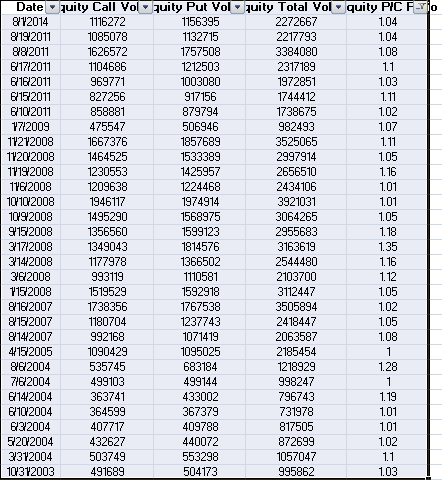
Equity Put/Call Ratio Greater Than 1.0 Instances Going Back To 2009

On Friday the equity put/call ratio spike to 1.04.  That is the first time in 3 years that it has exceeded 1.0.  While the initial contrary analysis of this data point is that the market is excessively fearful, I have a somewhat more complete view to offer, I believe.

What is evident going back over the last 2 bull markets and the intervening bear market is that the ratio spiking like this for the first time in a while may be a psychological point of change which is showing a shift to fear entering into the market that has not been present in some time.  This is the type of market psychology shift that I would expect to see as a market is topping.

If you go back through price charts you will see that the ratio spike has typically first occurred prior to an intermediate swing low forming.  So from this we can expect that the market will likely form a least a slightly lower low, which the S&P 500 did already today.

Secondarily, once an intermediate low did form after these prior instances, there were some sharp rebound rallies.  But notice that none of the clusters (even in the current bull market) marked a lasting low.  After some sharp rebounds, price broke to yet lower lows.  So from this tendency - which has been very consistent - I would expect a sharp rebound here beginning within the next 1-2 weeks, but possibly after a further acceleration to the downside.

Next, all three of the last clusters of readings (Jan 2009, June 2011, Aug 2011) all led to 2-4 week rally attempts with the bulk of the rally happening in the first 2 weeks.  So on this basis it may be reasonable to operate under the template that once we see a rally occur, we can look to short or inverse the stock indexes after a couple weeks.

Going back to the topping of the 2007 bull market high, the current market technical analysis set-up is most similar to clusters of readings above 1.0 that occurred in August 2007 and in June 2011.


  • The rally off the August 2007 cluster led to a slight new bull market high, which double topped in the S&P 500 and led to the final bull market high after 8 weeks, on Oct. 11th 2007.
  • The rally off the mid June 2011 cluster led to a slightly lower high in mid July in the the indexes (and a double or triple top on the Nasdaq 100), followed by a 21% high to low correction in the S&P 500.
So given the technical set-up here, in that we are still near the bull market high in prices, and the bullish psychology is still dominant, and the program trading systems are probably still set to "buy the dip", we may expect a rally back toward the highs on an upcoming rally.  The biggest difference at this point, is that the current decline is very shallow in comparison to the price damage that occurred after those highs.  So unless the decline deepens further, it would seem most likely that a new bull market high could very well occur here.


Click on Chart to Enlarge

This chart is the TOTAL put/call ratio with some analysis on it like I have shown in the past.  The point here is that relative to the recent trend the ratio has spiked to a statistical extreme.  That often at least slightly precedes significant lows, but it does put us on alert that the market may be primed to attempt a rally here.

After a similar spike in June 2013, stocks chopped in an up-down-up fashion for a week or so, before falling down another 3+% below the existing low of the correction.  So given the modest decline so far, and the tendency for divergences to occur at the turns, it may be a reasonable idea to go with here as well if we see stocks immediately start to rally from this point.

So hopefully this look back has been helpful in planning and formulating realistic expectations for upcoming market action.  I would suggest being ready for some further volatility.  And also recognize the significance of a high put/call reading as a potential point of recognition or psychological shift in the markets here.  Assuming that stocks don't fall apart from here - although not a safe assumption - the next rally may be a "last ditch" to exit the market on an investment basis before a broad spread sell-off takes place.  That is my take on it.

Stock Market Update

As of the break to new lows for this correction in SPY this afternoon, stocks have a very nice hourly chart bullish set-up with significant divergence present.  This is the type of set-up that often leads to nice rallies in the direction of the major trend.  So keep an eye out for that here.

However, the reversal attempt today did not manage to close in the top half of the daily price range, and so I don't view this as a bottom reversal day. 

Until there is a clear bottom reversal day, I view the larger pressure to be down here still.  That being said, the set-up is in place for a rally attempt.  When the larger currents are down, the nice bullish set-ups may be only lead to 1-3 day modest bounces, so that is something to factor in if taking bullish positions on a reversal attempt here.


Monday, August 4, 2014

Is the Current High in Stocks a Major Top?

Based on the application of logic to pattern based market analysis, we can contextualize market movements beyond a simple qualitative or visual analysis.

One of the key logical concepts to understand and apply to market pattern analysis, is that when an important phase of market action completes, the last portion of that price pattern should be completely retraced by subsequent price action  - in LESS time than the last part of the pattern took to form.

Additionally, if a larger scale or "degree" pattern has completed, then the new psychology of the market will be evident by explosive price action in the direction of the new trend.  In a practical sense, when a trend shifts, it is apparent on a price chart by a move that is both larger and faster than any counter trend movement in the prior trend.

Applying these concepts to the current market, I would say that if price is back below the May 15th low in SPY, by Aug 13th, then the price action would be logically confirming a large scale top has completed at the recent high.

So keep these ideas in mind moving forward.  If we do see such confirmation of a trend shift, it will likely be part of an explosive downward phase of price action.  In my experience, the initial phase of a trend shift can be very vertical and most traders will miss it and wonder kind of what the heck just happened.  Often times then the initial sharp movement down will be retraced by a more time consuming rally, that will offer a better and more clearly visible shorting opportunity.

Thus far on this correction, there has been no buy signal generated by my bottom spotting system.  If there is one I will note it here, but dependent upon the technical analysis at the time I may offer commentary as to whether I think it likely to be a successful signal.  Recent signals have been near perfect for over two years.  However, it may be reasonable to expect a solid bull market buy signal to be negated at the onset of a new major bearish trend.  We saw similar activity coming off the major 2011 highs.  I will here update as things unfold.

For now I personally view the dominant price direction to be DOWN in US stock indexes until otherwise noted here on this blog.