The 40% limit order on the option suggestion from yesterday seem likely to hit this morning with an indicated gap up and the possibility of at least a little bit of follow through after the open.
It seems to me that the ideal exit order here may be to set the limit order at 70% based on closest fits, which are a more narrow comparison than the stat table I showed yesterday. But again as noted in yesterday's comments under the post, a scaled exit may be wise. A third of the position could be exited at the 40% mark, and then set another third or even the final 2/3 to exit at the 70% limit.
I personally have chosen to place a 70% limit order for today's session for the entire position. By my estimates using an option pricing model, it would take a move to about 192.25 on SPY today to hit the 70% limit order. That would require a roughly 2% intraday gain.
Additionally from a charting perspective, the gap down from Monday's session is not filled. Its level is 192.85. And from comparable charts to what showed up in yesterday's scan, many of the corresponding gap down were filled within about 5-6 days, or sooner.
So the point is that I feel from both a chart standpoint and from a comparison of the most similar markets, that the 70% limit order has a good chance of being reached this week.
I have a limit order to exit the option I bought yesterday at 4.95.
Pete
Wednesday, September 30, 2015
Tuesday, September 29, 2015
Short Term Option Profit Opportunity in SPY - Brief Rebound Likely Within the Next Week

Today I ran a scan for the following conditions going back to 1995:
- SPY closes down more than 2.25%
- SPY gapped down at the open
- Daily and Weekly MACD are in the down position
This describes Monday session. If we add the condition that the next day gaps up, then the results are even stronger.
But this shows a very profitable short term option play by buying 1-2 weeks of time on the ATM option and setting a limit exit order at 40%. The Kelly Bet fraction is very high at nearly 60%. The win rate is very high at about 88% over the last 20 years. This data is based on a model of option prices with some reasonable and maybe slightly conservative assumptions built in. But the data shows a positive short term gain in the equities over the next 1-2 weeks. And the average max gain over the next week is 4.7% in the equity and 6.2% over the next 2 weeks.
So the odds suggest high volatility, with a strong chance of at least a brief rebound which would produce a profit within the next 5 days.
I have an order a little below the market to buy the Oct 9 calls at the 189 strike price. Then the limit order would be 40% to exit.
Pete
Waiting For Some Divergence To Anticipate a Rebound In Stocks
Currently as I review the MACD charts on SPY time frames from 15, 30, 60 minutes, there is no classic bullish divergence on any of those time frames. So that leads me to suspect that the short term down trend may not be complete.
Today stocks are set to gap up, but I would not be surprised to see price fails to rally in a significant fashion before another push to lower levels is made. That being said, IF price does push to a slightly lower low with some bullish divergence and price then reverses higher, I would anticipate a brief rally attempt which may meet resistance in the 195-196 region, which would be a pretty sharp move likely.
If SPY gets hammered down today with another major sell off after then open, then it would seem more likely to me that the August lows could be tested this week. So in short, I would not go long the equity side here yet, until at least a bullish divergence is present and price confirms a little upside with a bullish cross (moving average, MACD, etc) on one of those lower time frames.
Pete
Monday, September 28, 2015
Nothing New To Offer Currently on SP500 9-28-15
Currently stocks seem to be following relatively closely to the post stock "crash" pattern that I have mentioned several times recently. Currently the SPY price is still about 3.5% above the August intraday low near 182.50. However, the SPY price is less than 1% above the August daily closing low on 8-25-15. It would not be surprising to see a quick sell off over the next couple days to break the August low. That would basically fit the pattern expectations from past instances.
Note however multiple time frame stochastics oversold set up here with all time frames daily and lower being oversold on the 14,3,3 slow stochastics. So we may see some program buying/short covering kick in at any time. The weekly stochastics however, has crossed back down and is not yet oversold. So if a brief relief rally occurs from right at this level, while likely sharp if it occurs, may offer an opportunity to short with expectations of a very dramatic decline to follow, with the indexes headed to likely lower lows below the August low.
Currently I would not initiate a new trade in either direction. I feel a partial scale out of a short position is sensible here, however, I really think that the odds favor a break of the August low before a major rally attempt occurs.
I will be looking for a bullish option trade set-up shortly after a break of the August lows if/when it occurs. I think the scans will show a high odds play on a few scenarios once that low is broken.
Pete
Friday, September 25, 2015
Modest Rally Expected Here - Continuation Of Downside Is Expected After That

Click on Chart to Enlarge
With the little rally yesterday and today, the hourly stochastics has cycled back up to the overbought area at a lower high than the previous signal. Additionally yesterday's low clipped the 9-1-15 low before reversing. From a chart standpoint this is very common in my experience. From my perspective, if you are short, the safe stop level is above the high of 9-17-15. That high should not be exceeded at this point from my assessment of where we are in the post "crash" pattern. If Thursday's low is broken to the downside, I believe the stop on a short position could be moved down to above whatever intervening high occurs.
Given the most comparable market environments in the past 20 years, it would be expected for a brief 1-2 day rally (maybe 3-4 days) after the break of that minor low. Then the expected outcome would be for a very sharp break down to retest (and probably break) the August low.
This being said, the daily stochastics is now nearly oversold, and so from an indicator standpoint, there are some cross current that may indicate a few days or more of "sideways" or upwards action before a more ideal situation for a sharp downward move to continue. In all the instances highlighted in that comparison post, a rally occurred very soon after the break of the "crash" low. I don't really expect it to be different here.
If the bull market has topped, and a larger and faster decline than any in the bull market were to occur, price of SPY would have to decline to about 166 by the week ending 10-23-15. That would make the decline larger than the 2011 decline. Obviously that seems unlikely at this point and I don't expect that.
The next important time frame for an inflection point I believe to be in the 2nd or 3rd week of October, possibly near the options expiration on the 16th.
Pete
Sunday, September 20, 2015
Another Scan Suggesting Profitable Opportunity for Buying Puts 9-18-15

Click on Stats to Enlarge
I ran a scan tonight looking at times since Sept 1995 in SPY similar to our current market indicator set up and trend. The filters were:
- 63 day EMA is down
- 252 EMA is down
- Weekly MACD is below signal line (sell configuration)
- Daily % D stochastics is greater than 75
- Today is a cross down of %K below % D in the daily stochastics (14,3,3)
Looking at the 2 month future results, the MAX loss was greater than 2 times the MAX gain in SPY.
And in the options, buying an ATM put option and holding until expiration would have been a winning play with a few real big winners which basically occurred in the context of bear markets, where a rally had occurred and stocks sold off hard in a continuing down trend.
The EV of the 2 months ATM puts was 45%. So this fits right in line with the recent scan I showed where the stochastics was overbought in a downtrend.
So basically from the stats there seems to be a roughly 50/50 chance of a substantial sell off. If there is a sell off, it may be substantial.
In follow up to the recent comparison of our markets to past "crash" markets over the last 20 years, there has been a pretty consistent time pattern of the post crash retest of the crash low. And it has occurred in about 5-7 weeks in the 5 instances I highlighted in the linked post. That time frame would put us in mid October, right around options expiration. And that time frame would fit with an ideal seasonal bottoming time frame.
Given the technical indicator set up, it may be expected for a sell off to new lows below Aug 24th in SPY, followed relatively quickly by a rally attempt. I would anticipate the 177 level on SPY as being a Fibonacci support level if 8-24-15 low is broken.
Pete
Friday, September 18, 2015
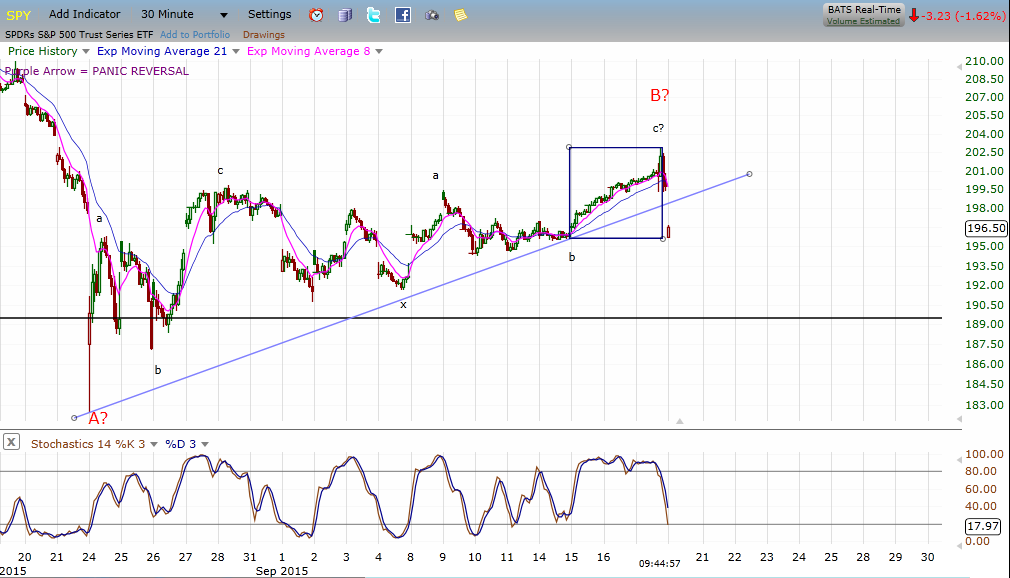
Rebound In SPY Likely Complete 9-17-15
Click on Chart to Enlarge
As suggested in yesterday's post, the multiple time frame momentum set-up in SPY was ripe for a decline and it appeared that a complex corrective pattern abc-x-abc had complete yesterday in price and time.
This morning's gap down is supporting evidence. The blue rectangle shows the price and time box of the most recent "c" wave. After a pattern completes, the psychological price logic/evidence is confirmed by a complete retracement of the most recent trending move in LESS time than it took to form. We very nearly met that guideline on the gap down opening this morning.
Also note that the gap down today broke the uptrend line of the whole move since Aug 24th. This is pretty common of a breakaway move.
So any upwards price action from here would be expected to be minimal (maybe a back test of the broken trendline in the 198-199 range). So using short term stochastics to time a short entry would probably be wise. A 5 minute overbought stochastics would be my recommendation. Any stop on a short currently needs to be above yesterday's high in my opinion. Profit potential based upon historical comparisons may be to about 177 on SPY. The would be about a 127.2 retracement of the rebound since Aug 24th.
Pete
Thursday, September 17, 2015
Multiple Time Frame Set Up On SPY 9-17-15
All stochastics from 5 minutes up to 60 min have bearish divergence at the current time frame Thursday afternoon. This is in conjunction with the daily stochastics overbought.
This appears to be a very mature set-up for a top of a counter trend rally since August 24th. A confirming move in price is not yet apparent, but all the signs are in place. Given the options scan I posted earlier this week, it seems a November expiration put would be an appropriate play here based on profitable stats over the last couple bear markets.
The structure of the correction also appears to be complete in form and time as of today. A cross of the 30 minute 8 EMA below the 21 EMA would be a reasonable price confirmation signal to initiate a short trade with a stop above the intervening high.
Pete
Tuesday, September 15, 2015
Time For a Grand Slam Swing - SPY Puts 9-15-15
I ran a scan today based upon current market action and found data suggesting an opportunity for a profitable play in index puts. Data only goes back 20 years (to Sept 1995).
I may provide more detail later, but the scan had the following criteria:

I may provide more detail later, but the scan had the following criteria:
- 63 daily EMA is pointed down
- 63 daily EMA is below the 252 daily EMA
- 14,3,3 daily %K stochastics is greater than 75
- Daily MACD line is above the signal line
- Today's gap up is greater than 0.25%
Buying an ATM put option with 2 months until expiration and holding until expiration resulting in an average expected value of 59% gain including losers.
So a simple play here is to buy a November put option and hold until expiration. If a high quality bottom reversal signal comes prior to expiration, the trade could be exited as well. Such a signal will not likely come from my algorithms unless the August low is broken.
So the simple set-up here is that stocks could fall hard and cause a big move in the puts. But a loss would be expected to lose the whole option premium. So the Kelly Bet fraction was only in the 20-22% range. Out of 28 instances, there were 11 instances which ended up in a profit position.

Click to Enlarge
Pete
SPY Multiple Time Frame Stochastics Short Set-Up

Click on Chart to Enlarge
Currently SPY has broken out of the small triangle shown in yesterday's post. It appears set to test the 198.40 harmonic zone.
As I type, there is a developing multiple time frame stochastics set up which appears to be setting up an ideal short as price reaches this harmonic zone.
- 5 min overbought
- 15 min overbought
- 30 minute overbought
- 60 minute likely overbought later this afternoon
- Daily nearly overbought today; possible overbought tomorrow
So if signs of bearish divergence on the 60 minute and under time frames show up without last Wednesday's high being exceeded, that seems to provide a low risk entry for a short position with a possible stop above Wednesday's high.
Even if Wednesday's high is exceeded, the multiple time frame analysis still suggests that the short term is basically overbought within a weekly time frame downtrend where stochastics has not yet become oversold.
Remember the FOMC announcement tomorrow. This will likely bring some volatility into play tomorrow afternoon and beyond.
Pete
Monday, September 14, 2015
Sideways Sloppy Trade in SPY
As somewhat expected in the days preceding a FOMC announcement with potential volatile responses, market action has been muted today.

The two key levels I see in the short term as market resistance are 196.15 and 198.40. The 196.15 area is roughly the center of a contracting symmetrical triangle occurring on this 15 minute chart. The 198.40 level is a harmonic level for the completion of an upwards ABC pattern off last Thursday's low.
Price breaking last Thursday or Friday's low will likely be a bearish trigger I think.
A move above this morning's high, would very likely push price to test the harmonic zone at 198.40, I think.
I still favor the downside as the next significant move here. Last Wednesday's high is the clear stop point based upon the short term price logic and a classic bearish engulfing candlestick.

Click on Chart to Enlarge
The two key levels I see in the short term as market resistance are 196.15 and 198.40. The 196.15 area is roughly the center of a contracting symmetrical triangle occurring on this 15 minute chart. The 198.40 level is a harmonic level for the completion of an upwards ABC pattern off last Thursday's low.
Price breaking last Thursday or Friday's low will likely be a bearish trigger I think.
A move above this morning's high, would very likely push price to test the harmonic zone at 198.40, I think.
I still favor the downside as the next significant move here. Last Wednesday's high is the clear stop point based upon the short term price logic and a classic bearish engulfing candlestick.
Friday, September 11, 2015
Bearish Short Term Pattern Set-Up - SPY 9-11-15

Click on Chart to Enlarge
Currently the short term picture of the market is indecisive. Wednesday's high is certainly a key point on the chart.
The chart shown here is a 15 minute of SPY. What we see is that there is a perfect fibonacci confluence at 198.40 for a possible bearish reversal of an upwards ABC pattern. Any time the subdivisions in a pattern have a perfect overlap of fibonacci ratios like this I take notice. These tend to be key areas.
There are a few comments I would make here:
- Stocks are likely to rise to that level before reversing lower
- Given the other factors I've posted about, I would anticipate a move lower from that area
- Failures of a key confluence zone to hold often are followed by a significant continuation
So for the short term trader, a clear set up would be for a 15 minute indicator set up of bearish divergence above Thursday's high and below Wednesday's high. Likely a 30 minute stochastics overbought signal would occur in conjunction providing a dual time frame set up of 30 min overbought and 15 minute bearish divergence to look at a short entry. A stop could be set above Wednesday's high.
From the time relations of the pattern, it appears that Monday will be the day at which price is likely to test the resistance area. At least a mild pullback from the resistance area of a confluence zone like this almost always occurs, in my experience. However, if that is followed by a break to yet higher highs, there could be follow through. So having the stop in place to protect is very important. There is no "safe" stop below Wednesday's high.
The FOMC is scheduled to report next week, so it would seem likely that the market will remain relatively quiet until mid next week.
Wednesday, September 9, 2015
SPY Short 9-9-15
If you took a short position in SPY over the last 1-2 days based upon information from the blog here, please comment below with entry price and any questions in regards to trade management.
With the bearish engulfing pattern today, it seems likely that today's high should hold in the short term for an established short position.
I would guess that we are headed to retest the August low from here. From past comparisons I still am not convinced that price is ready to break the low and hold. If I had to choose here, I would suggest a scaled exit strategy taking one part of the position off at a modest profit, rather than hold the whole part expected sustained weakness.
I will update as the action unfolds and any bottom reversals occur (assuming price does decline from here of course.
Pete
Short Term SPY Pattern Analysis 9-9-15

Click on Chart to Enlarge
While the focus of trading is on objective signals or occurrences that lead to a profitable expectation based upon historical testing, the use of more qualitative patterns, is intriguing to many of us, and is certainly valid to some extent as a filtering process for trade selection.
Based upon the overlapping market action since the Aug 24th low, it seems very apparent that a correction/consolidation has been occurring rather than a trending move to the upside. The simplicity of this should alert us to the probability that there will be a further move to the downside after the consolidation is complete.
From a "wave" perspective I would make a couple observations here. The upward moves since the low have a generally shortening or contracting bias implying weakening. It seems possible that a small complex correction abc-x-abc is completing either today or tomorrow. Since the upward moves are contracting, it may be a rising wedge/triangle pattern abcde.
In either case, the bulk of the move is done, if not complete at this morning's high. From the 15 minute MACD, it appears ideal for another push to a yet higher high later today or tomorrow before a top occurs. That would also create a probable bearish divergence in the hourly stochastics and create a situation where all the times frames from 15 min to 240 minute stochastics are overbought. On a short term pattern like this, that would seem to be an ideal conclusion.
Any move below Tuesday's low would seem to break the uptrend since August 24th and likely indicate at least a short term top and probable retest of the August 24th low.
If the pattern is a double correction abc-x-abc, we should expect a rapid move back below the 191.60 low from 9-4-15. And that move should take less time than the last "c" wave takes in order to provide confirmation from the price logic standpoint that a new downtrend has begun.
So there are a number ways to play this if not already short. Here are a couple ideas.
- Short on a cross of the 8 EMA below the 21 EMA on the 15 minute chart (stop above the highest point of the pattern.
- Use a sell stop to short on a rapid break of the recent "b" point.
My mind doesn't like to sell after a decline. I prefer to sell as a top seems to be forming with bearish divergences, and use chart resistance or statistics in order to establish a stop level. This method will often allow a quick movement of the stop down once there is an initial break or indicator action suggesting a top has occurred.
Trade Management Example:
-Short SPY at 198.00. Place the stop at 203.00
-Exit half position at a limit of 195.50. Move stop down to 200.50 (or lower).
-Then continue to manage the trade with a stop adjustment technique using an indicator or moving average channel.
-Exit the trade at the next 15 min MACD bullish divergence if not stopped out.
SPY Update 9-9-15


Click on Charts to Enlarge
These charts show some of the best comparisons to the current market environment. The blue arrows show where I believe is a corresponding region in the pattern to our market right now.
Some of these instances broke above the initial reaction high briefly. Other only retested it before a break or deeper retest of the "crash" low.
From the qualitative comparison as well as the stat scan that I have run, it seems likely to me that some short term weakness is ahead.
Tuesday, September 8, 2015
Further Details On SPY Short Set Up 9-8-15

Click on Stats to Enlarge
I ran one more filter on the data from today's short set-up, and this made a huge difference suggesting a more pronounced downside, and lasting further into the future.
The additional filter I added to the scan was that the close of today's session was in the upper end of the day's range (above the 80% mark of the day's range). So the gap up was followed a strong close.
Again this was in addition to a daily MACD "down" and the >1.5% gap up.
There were only 17 instances of this with the closing returns 7 trading days into the future shown above. (Data only goes back 20 years).
The MAX loss versus MAX gain was greater than 2:1 in favor of the downside in the time frames out to 10 trading days ahead. And the average closing return jumped from 0.5% profit on the short to ~2.5% profit on the short at 8 days out.
So if SPY closes strong here, as it look likely to as of 3 pm EST, then that would argue for even greater downside expected over the coming days.
For disclosure, I purchased an Oct 196 put this afternoon. There is not a clear option limit target here, I will likely place an OCO order for stop and a limit gain after I see a few days of action. But I am prepared for the possibility of a 100% loss on this trade, even though i do not expect to take it.
Pete
SPY/SP500 Short Set Up Here 9-8-15

Click on Chart to Enlarge
Based upon the stats shown recently which suggest that stocks will likely have a deep retest of the August lows, and the contracting bias of the action since the August low, it seems like stocks will break up or down out of the contraction in the next day or two.
Looking at the stochastics on this hourly chart above, we see that it is in the overbought region at a LOWER high than the last overbought signal last week. From a price logic standpoint, if Thursday's high is not exceeded by tomorrow, it would suggest a continuing downtrend.
So there are a couple options here as far as positioning for a potential move.
- Wait for a breakout of this small triangle (probably tomorrow) and possibly initiate a trade depending on the price action.
- Get short here, based on the technical signals so far suggesting a possible overbought at a lower high in a downtrend set-up (with trade stats showing that most of the expected rally from recent signals was likely to occur by this week....based upon historical similarities)

Click to Enlarge
So from a practical standpoint, I would suggest risking a little less of the account value than suggested here if stopped out. The trade stats are most negative on day 1 after this signal, with an average close a little more than 1% down on the day following the signal (tomorrow in this case). The trade stats above are based on 8 days out and will be a little less aggressive on the position sizing.
Hope this helps on the equity side. Comment if there are questions needed to clarify. This is a time sensitive trade because stats would include the overnight gap, which in this case of past signals has averages about -0.3% suggesting more likely a gap down tomorrow, which would be in line with the expectations noted above.
Pete
Large Gap Ups In a Downtrend - Weakness Likely Ahead For Stocks
In follow up to the weekend post, obviously SPY is not gapping down this morning.
Actually SPY is set to gap up about 1.8%.
I ran a scan looking at gap ups greater than 1.5% and the stats consistently show weak returns with risk profiles skewed to the negative over the next several days.
When I filter the scan for a couple other factors which are occurring right now (MACD daily is down, and the previous trading day there was a 1% or greater gap DOWN), then the results were even more pronounced to the bearish side.
The returns are by no means a landslide win for the short side, but there are very few instances where the average closing returns are consistently negative. In the current case, the forward average closing returns are negative out to 8 days.
 Click on Stats to Enlarge
The risk profile for short term options is not really attractive in that there were a number of instances where this type of action happened near a bottom, but in a few instances the returns were huge.
My opinion from the comparisons that I have highlighted here, is that stocks are likely to retest and probably break the August low. I think given the seasonal tendency for September and October to be the sell off months, that the re-test will probably occur by October option expiration. That seems to fit very well with the closest fit instances from the past as well as known annual cycle tendencies.
I am planning to wait for things to trade for a while early this morning, and then purchase an Oct. put option at some point. Closest fit past instances suggest that if price can even make a new high above the recent reaction high on 8-28-15, that area should be resistance on a scenario as I have suggested here.
Pete
Actually SPY is set to gap up about 1.8%.
I ran a scan looking at gap ups greater than 1.5% and the stats consistently show weak returns with risk profiles skewed to the negative over the next several days.
When I filter the scan for a couple other factors which are occurring right now (MACD daily is down, and the previous trading day there was a 1% or greater gap DOWN), then the results were even more pronounced to the bearish side.
The returns are by no means a landslide win for the short side, but there are very few instances where the average closing returns are consistently negative. In the current case, the forward average closing returns are negative out to 8 days.

The risk profile for short term options is not really attractive in that there were a number of instances where this type of action happened near a bottom, but in a few instances the returns were huge.
My opinion from the comparisons that I have highlighted here, is that stocks are likely to retest and probably break the August low. I think given the seasonal tendency for September and October to be the sell off months, that the re-test will probably occur by October option expiration. That seems to fit very well with the closest fit instances from the past as well as known annual cycle tendencies.
I am planning to wait for things to trade for a while early this morning, and then purchase an Oct. put option at some point. Closest fit past instances suggest that if price can even make a new high above the recent reaction high on 8-28-15, that area should be resistance on a scenario as I have suggested here.
Pete
Saturday, September 5, 2015
Possibility of Back to Back 1% Gap Downs on Monday

Click on Stats To Enlarge
First off this stat profile is NOT currently active. It is looking ahead to the possibility of a 1% or larger gap down on Monday in SPY etf.
The stat sheet shows the instances of back to back 1% gap downs in SPY going back 20 years. Note that it does not include the action from the recent sell off in August, though they fall in line with these stats.
There are about 30 instances and there is a clear bias to the upside in the short term. There is about a 2.5:1 max gain to max loss ratio in the first 3 days (after the close of the second 1% gap down day). That skew diminishes moving forward to where it is almost at par at 1 month ahead.
The strongest opportunity from the stats occurs within the first 3-4 days after the second gap down. And there is a clearly positive options play using a 1 week to expiration ATM call option. The maximum expected value would occur with a 40% limit order to exit the trade according to the past data.
I just wanted to get this out ahead of time so that we can anticipate this potential opportunity next week and be ready to take action at Monday's close or possibly intra day if there appear to be an intraday reversal likely to occur based upon short term divergences.
For the equity trader, the indication is clear that a positive long trade set-up would occur in this scenario. And I would suggest a 15 minute or 30 minute chart for analysis and trade signals. Also a trailing stop technique would be used. And exit would be ideally upon a bearish divergence of the same time frame used for entry.
Note that the scenario highlighted here would be totally consistent with the previous posts regarding the closest fit historical instances with a retest of the low followed by a sharp price rally at least briefly.
As we see the indicated gap down from the futures activity on Sunday night and Monday morning, I will follow up on this post possibly. If there are questions, please comment below the post.
Pete
Friday, September 4, 2015
Stock Market Update 9-4-15 - What I Expect Based on The Best Historical Fits
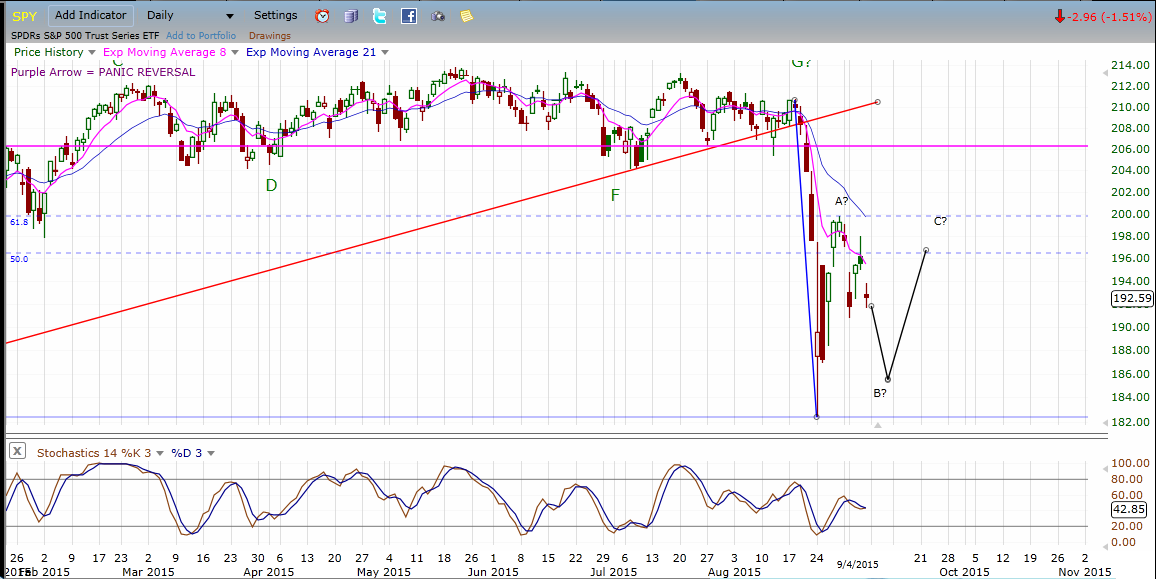
Click on Chart to Enlarge
This chart shows the SPY etf daily chart with a proposed future path of price action based upon similar instances of price action in 2008 and 2011, as well as 2000.
The market has a way of making a whole bunch of price movement in a short period of time, and then just when everybody "knows" the trend, it chops around and creates trendless volatility, which functions in the market ecosystem to destroy the weak and leave only the strong.
The closest fit past instances to the recent market plunge consistently show a choppy retest of the "crash" low, followed by another reaction rally as the low is retested.
From the stats that I have looked at in the past few days, as well as the chart comparisons, I would project a further retracement towards the low, followed by another sharp buying rally.
Option expiration occurs Sept 18, and I think that could be a factor in seeing prices stay range bound until expiration. I think with the August expiration occurring on the 21st, and then the big gap down and plunge the following Monday, option buyers were likely to be active in days since the plunge. However, the in the options market, it is the sellers that are the long term winners. And in the mysterious ways in which the market behaves, I think that the sellers will win the battle until expiration. Basically the closer the price action expires to middle of the range since Aug 24, I think that would likely punish the near term option buyers.
So from my standpoint here, the next key trading opportunity will arise as price retests the recent low.
I think the 15 minute or 30 minute charts will have to be used to get any reasonable reward to risk ratio on the ETF side of trading.
I do feel that short term option plays will present themselves as we continue to move forward.
Pete
Thursday, September 3, 2015
SPY Call Option Profit Limit Hit Today
Basis the SPY Sept 11 192 strike call from Tuesday's closing price, the 70% limit order was hit today. So the trade is closed as far as my recommendation and tracking here on the blog.
I think a nice put/short opportunity will arise if price is able to push back up above today's highs with in the next couple days. If price rallies modestly tomorrow, I may enter a bearish option position going into the weekend.
From the stats posted earlier this week about 3% down days, there was a clear tendency for a short term rebound, but the future returns turned overall negative as time moved forward. And at 3 weeks out, the average closing price was about 4% lower than the average close 1 week out. So since price has rallied a bit already, it would seem that looking out a couple weeks, we could see a pull back. That is totally in line with the closest historical fits from the charts, and is backed up by the objective historical stats.
Pete
SPY Call Option Follow Up - Exit Plans
The suggested ATM SPY call options from earlier this week should be entering the exit zone today.
So based on the stats we looked at, setting a 40% limit order should be a very high probability of success trade. That limit order looks like it will hit this morning.
I had suggested using a 70% limit order to exit the trade. If price moves up a little further into the gap down from 198ish, that order will likely hit. So, I don't have anything new to offer other than possibly suggesting a scaled exit taking part of the position off at 40% gain, and then using the 70% limit order for the rest of the contracts.
Pete
Tuesday, September 1, 2015
SPY Call Option Limit Order Suggestion
I would suggest placing a limit order of 70% gain from today's closing value in order to exit the suggested option strategy mentioned today (Sept 11 ATM call option).
This takes into account some other criteria not shown earlier today. For this order to fill, it would take a rally back well into the gap area from today.
Pete
This takes into account some other criteria not shown earlier today. For this order to fill, it would take a rally back well into the gap area from today.
Pete
Today's Action In Context - SPY Down 3% After a 2% Gap Down

Click on Stats to Enlarge
This table looks at previous instances of days when SPY gapped down 2% and then closed down greater to or equal than 3%. Data goes back 20 years and does not include August of this year (which wouldn't change it).
What we see is consistent/profitable bullish opportunities on average. In this case, the stats look at a 5 days hold, which is the maximum closing return on average. 77% close higher 5 days later, with the average gainer up more than 4%. The average total expected value, including the losers, is 2.7%.
The few instances that were losers were basically in the waterfall declines preceding sharp bounces. So they still had 3-8 days before bottoming out in the short term and putting in a sharp rally.
So the stats here don't add that much to the earlier post. If tomorrow gaps down, I would expect an even stronger stat profile, but obviously instances are getting fewer as well.
Again this is short term info in the context of a probable continuing downtrend.
Pete
SPY Gap Downs of Greater Than 2% - Short Term Bullish Option Play
Today SPY gapped down over 2%, and so I looked at other times when SPY gapped down over 2% while the weekly MACD was down. The short term stats show a clear upside bias for about a week. The peak closing gains in the short term were 6 days out.
Looking at the options part of the assessment, based on my pricing model, an ATM call option purchase with 2 weeks until expiration would provide the maximum value play. The maximum expected value would be to enter the trade and set a limit order of 160% gain to exit.
Local maximum expected values occurred at 40%, 80%, and 160% limit orders. The stats below show the overall trade stats. Given the current market environment, I feel that the 40% or 80% limit order would be more appropriate for the market overhead resistance.
Which ever the case, they are positive EV plays, and the position sizing would vary depending on the exit limits. The Kelly Bet % will give guidance on that. And psychologically, an 80% win rate trade like the 40% limit order is nice in that it gives frequent wins and reinforces sticking to solid trades and planned exits.

This shows the stats for a 2 week till expiration ATM call exited with a 160% gain limit order. This gives the maximum expectation at 30% per trade.

This shows the stats for a 2 week till expiration ATM call exited with a 80% gain limit order. This has a higher win % at 66% but a little lower expectation.

This shows the stats for a 2 week till expiration ATM call exited with a 40% gain limit order. This gives the maximum win rate at 80% but a lesser expected value of 12-13%.
I personally took the trade and have the 40% limit gain order in place to exit, which would happen on only a partial fill of today's gap down within the next couple trading days.
Subscribe to:
Posts (Atom)