Friday, September 9, 2011
US Dollar and Silver Update
See the chart above for notes on the US Dollar. There are several technical signs of a new uptrend. Price has now moved above a prior intermediate term high after forming a higher intermediate term low. The ADX line has jumped above the 20 level with +DI above -DI. Price has closed several days outside the upper bollinger band with the bands expanding. All these are suggestive of a breakout move in a new trend.
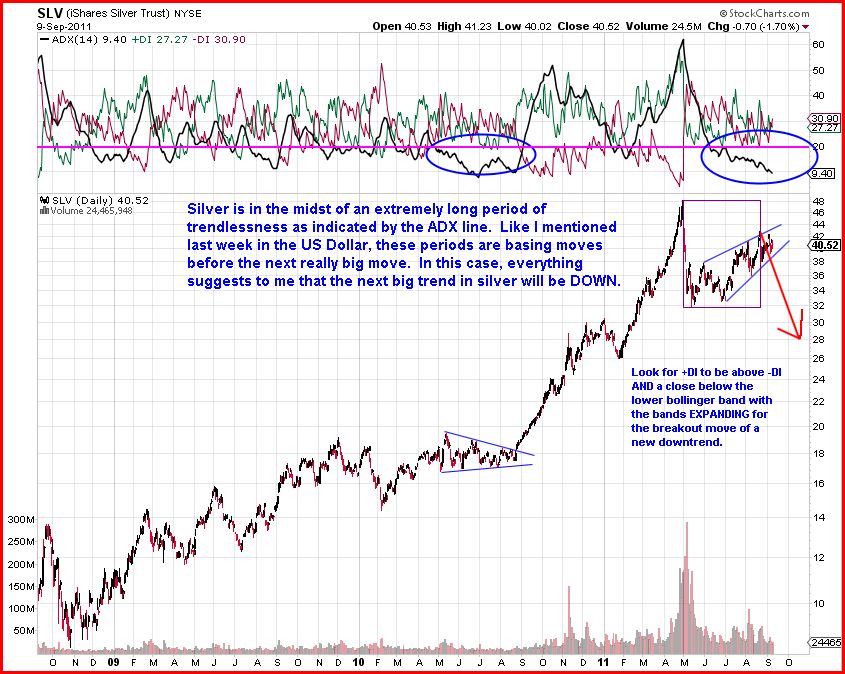
The US Dollar typically moves inversely to commodities. If the US Dollar continues up, then we are very likely to see commodities continue to decline. Cotton, silver, and coffee were 3 commodities in this recent bull market that made huge historic advances, which indicates the likelihood of major corrections or bear markets to follow. We already saw a big decline in cotton and captured a lot of it in a blog trade. Silver should be in a similar boat here.
Notice that silver looks a little like the US Dollar over the last year, but upside down. Silver is still in a lengthy trendless phase, which should be a basing for the next large move. This should be down. Based on the fact that this rally in silver since the spring low has taken much longer than the decline, I expect the next declining phase to take about half the time of the decline and the advance together. That could be used to determine how much time to buy on an option trade.
I already have Oct 34 puts on silver, but my plan is to add a new put trade on silver if/when it breaks down and closes below the lower bollinger band with the bands expanding. I will buy about 3 months of time and look at slightly out of the money strikes.
Tuesday, September 6, 2011
Bonds/Yields Update
As of the next day or so, it looks like an ideal form, time, and technical bottoming scenario for long term US bond yields. This means time to sell long-term bonds.
I will post a trade on TBT (inverse bond ETF) if/when the entry looks good over the next few days. Waiting for a break of the wave 2-4 green trendline is a safe entry, though a good indicator signal may come slightly before that.
The long term context shows spiking of bonds prices to 2008-2009 levels, but yields still well off the lows of 2008-2009 creating a non-confirmation that is bullish for yields.
From an investment standpoint then here is my analysis in a nutshell:
-get out of longer term government bonds and all "junk" bonds
-On an investment basis I have suggested being out of stocks for the last 2 years basically, and I still believe that will be shown to be wise as a longer-term suggestion (S&P 500 prices likely to go to the 900's as a bare minimum in the not too distant future)
-commodities including gold topping and entering bear market
-US Dollar set to gain against foreign currencies
So here is the non-speculative take home play: stay in cash (even literally dollar bills in a safe) or in funds of the shortest term US treasury bills which are extremely unlikely to default though they have a miniscule yield.
US Dollar Update
Click on Chart to Enlarge
Today's large gap up after recently breaking out a wedge, and a possible longer term pattern completion all suggests that we are likely to see continued pressure on commodities and that the markets may be shifting to a deflationary theme in coming months.
The advance should be very sharp (sharper than the May advance) in the dollar index if a bottom is, in fact, in place.
Several markets, I believe are near very significant turns. I will update on bonds ASAP, but the suggestion is that US 30 year bonds should be topping, I think this week. Cash is the place to be right now.
Harmonic Resistance at 1226-1232 on SPX
There are multiple harmonic and chart resistances right in the 1226-1232 range on the S&P 500. I am viewing this as possibly a "point of no return" for the markets for quite some time. Inside the pink oval on the chart I have shown 5 harmonic resistance levels though at least one more of significance could be added.
Inside that little zone are the:
- 50% retracement level from the July high to August low
- 61.8% retracement of the 2007-2009 bear market
- A=C for an upward ABC correction since the July 9th 2011 low
- 141.4% extension/external retracement of the "B" wave of the upward ABC since Aug 9th
- 38.2% retracement of the July 2010 to May 2011 rally
- major horizontal chart support which has been a breakthrough and resistance point for 4 severe market swoons since year 2000
Keep that chart level permanently on your charts for future reference should the market continue to chop around these levels.
The next major horizontal chart support zone is the 1050-1070 area. Should the market break through the Aug 9th low, I think it will likely move down to that 1060ish area before a possible rally attempt.
Below 1060 the next major support is the 940 area. I am keeping those area bolded on my charts for future reference as we may see the markets move sharply to these levels if/when support levels are broken.
Friday, September 2, 2011
SPX and CRB Update - Possible Sharp Downside Next Week
The CRB commodity index looks like it may be forming a tradable top here in a complex downward pattern/channel. The pink dashed "sell" line would be my sell trigger level once stochastics is overbought and makes a bearish cross like this. See the notes on the chart for the price/pattern logic.
The S&P 500 has formed and extremely attractive upward ABC pattern since August 9th and had some nice reversal down from the resistance zone the last 2 days. That being said, I don't like the time relationships or channeling here that great for a textbook "flat" to form. But the harmonic and chart resistance area is extremely nice with multiple resistances at 1225ish on SPX. I will probably post these on another chart. The price logic still suggests a downtrend here because the upward moves are not retracing the downward moves in less time than the down moves took to form.
IF this is an upward flat pattern, then to confirm that we should see the market drop sharply next week to break below the bottom of the pink box. If we see that, then I think the next possible bottoming time frame in stocks will be late Sept to mid October. Some time relationships suggest Sept 26th-Oct 12th. See the chart for further notes.
Thursday, September 1, 2011
Trade Set-Up on Inverse Index ETF's
The set-up for a bearish trade is coming along nicely here. There are a few strategies that could be used for entry. One strategy I mentioned in a recent post which was to wait for the %D line on the daily fast stochastics to go back below 80 and enter then. Another method is to place a sell stop at the trailing 1 candle low once a bearish cross occurs on stochastics. In this case the sell stop would be at the low of yesterday's trade. The stop would go above whatever high is made on the current 2 week rally.
An alternate method would be to use the hourly chart with the same indicators I showed on the EUO trade last post. Wait for the -DI to cross above +DI and for the MACD to be in a sell signal and enter short with a stop above the recent high.
New Trade Order:
Place day only buy stop order at 49.00 on TWM (2x inverse Russell 200 ETF). Place a GTC sell stop below today's low if filled.
New Trade - EUO
The US Dollar has jumped this morning and broken the trendline of a downward sloping wedge/triangle. It actually gapped up up above the trendline which is really nice for the beginning of a new trend.
Given everything discussed on this blog about gold, silver, commodities, and the US Dollar, I am going to post a new trade entry here on this. Notice that the +DI has crossed above the -DI and the daily MACD has made a bullish cross this morning. I like this combination of indicators, and an indicator exit can be made when BOTH the MACD makes a bearish cross above the 0 line AND the -DI crosses above the +DI. At that point a trailing chart based stop could be initiated as well rather than immediate exit.
Buy EUO today with a market order. Place a GTC sell stop at 16.45. Blog entry is 17.17.
Subscribe to:
Posts (Atom)