As of this morning 6-1-17 the technical analysis of the SPY etf shows weekly, daily, and hourly chart bearish divergence on the MACD. What does this mean?
The weekly time frame divergence is the longer signal showing both "overbought" levels and new price highs with less "momentum" or rate of change at the newer highs. This is a longer term signal that often is present at the end of bull markets and often at the end of major advancing phases of a bull market prior to a deep correction (say 10-20%).
The daily time frame basically then shows that there is loss of momentum occurring in the most recent leg up to new highs.
And then the hourly time frame shows that there is loss of momentum in this final little move occurring on the last daily push to new highs since the last cross down on the daily MACD.
So taken together, it is like a multiple waves of different frequencies all coming together at once and reaching a crest.
In my observation for the last 12 years, these points are often significant and should alert to the possibility the market will experience a major correction over the coming weeks/months.
Certainly at times, these signals may be in the middle of a major move up, and the results ends up only being a temporary range bound market before continuing higher. But factoring in a number of indications of sentiment and breadth, it seems likely to me that stocks will stall and correct a bit quite soon.
It appears unlikely to me that this will be a bull market top. Particularly with the Nasdaq not displaying any bearish divergence on the weekly MACD, it seems more likely to me that the current position is nearer to the momentum peak of this portion of the bull market, but it could take months and some small to intermediate corrections and breaks to new highs, before a more long term high could be set.
Pete
Showing posts with label MACD bearish divergence. Show all posts
Showing posts with label MACD bearish divergence. Show all posts
Thursday, June 1, 2017

Thursday, May 18, 2017
1.5% Decline in SPY the Day After a 52 Week High - Bearish Implications for Coming Weeks
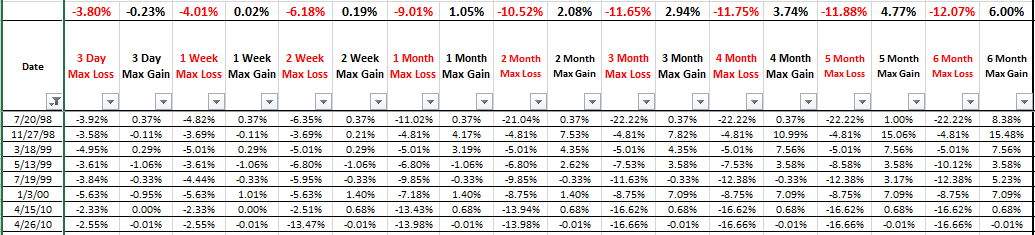
Click on Table to Enlarge
The above table shows instances in the history of SPY going back to 1995 where a 52 week high was followed the next day by a loss of greater than 1.5%, which is what we saw yesterday in SPY. This filter also look for only times where there was MACD bearish divergence on the weekly chart at the 52 week high.
From the closing value of the day of the 52 week high, every single instance lost at least 4.8% over the next month of trading.
Even taking out the filter of the bearish divergence on the weekly chart, the results were that 11 out of 12 previous instances declined at least 4.8% over the next month.
So this adds further weight to the outlook I posted earlier today based on the more subjective qualitative price pattern and a general view of conditions.
So given this back test, it is putting us on alert that stocks are likely to fall a few more percent in coming weeks. And a few of the past instances led to sizable corrections of 10-20%
About half the past instances showed an approximate 1 week rally to back near the highs after the first 1-3 days of decline, before then selling off strongly again.
The other half of instances basically had no substantial bounce after the initial big down day.
If there are questions about how to make a trade with stops and limits here, comment. But the idea is that after a little further decline over the next 1-2 days, stocks rebound for a few days, and that may be an ideal time to use an inverse ETF to try to capitalize on probable further sell off.
Pete
Subscribe to:
Posts (Atom)