Showing posts with label equity put/call ratio. Show all posts

Monday, February 12, 2018

Expect Another Round of Selling After A Possible 1-2 Week Rally from the Recent Lows - 2-12-18

In follow up to a post from last month on put/call ratios which was timely and gave forewarning of the potential for a sizeable sell off to come over the next few months, I want to reflect on the development of those comparable instances to gauge how the decline may unfold and see what type of readings (in the indicators which flagged the decline) showed up at the end of the correction/leg down.

I had looked for times when:

  • 21 day avg. of EQUITY put/call was less than or equal to 0.92 of the 84 day average
  • 5 day avg. of TOTAL put/call ratio was less than or equal to -0.95 standard deviations below to the 20 day average

As the ensuing sell offs developed, there was tendency for a 1-2 week rebound rally to occur when the 5 day avg. total put/call ratio rose above 1 st. dev above the 20 day average.  At the first occurence of this, the above mentioned equity p/c ratio had moved back up about ~1.0.

However, that rally offered a secondary selling opportunity.

When the corrections had bottomed in the other instances, the 21/84 equity p/c ratio had flip flopped to a reading of 1.08 or more, indicating a comparable imbalance in the opposite direction.  When those levels had been reached in the longer term eq. p/c ratio, then a total p/c reading indicating extreme pessimism was a great indication of a more lasting rebound attempt.


So our current market seems to be following this template so far.  The initial plunge over the last 2 weeks, has led to a short term spike in p/c ratios.  But the 21/84 equity p/c ratio has only just reached back to 1.0.  

The current small rally may be expected to continue for several days.  But the past instances would suggest the probability that another move down will occur with a higher 21/84 ratio.  And that could very well make a significantly lower low.  A shorter term pessimistic extreme in the ratios which occurs in that context would fit the template for a larger rally attempt.


Pete

Tuesday, August 19, 2014

How Far Is This Current Stock Market Rally Likely to Go?

In a recent post I highlighted the rise in the equity put/call ratio to above 1.0 and suggested that we would see at least slightly lower lows followed by an inevitable swift rally with most of the gains in the first 2 weeks of the rally.

Well here we are now and it appears that so far things are playing out very much as suggested/expected.  Today will market the 8th day of the current rally off the 8-7-14 low.  And it definitely has been a swift and directional advance.  So now that we are in the time frame of where we may expect things to slow down or for a possible larger scale top to complete, let's look at some more details.....


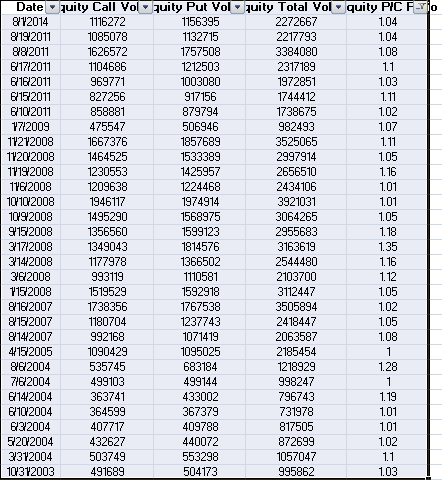
This list shows all equity put/call readings greater than or equal to 1.0 since CBOE data available in 2003.  I had suggested that the Aug 2007 and June 2011 instances were the most technically similar in recent years with overbought and divergence conditions on the weekly time frame already being in place.

If we replicated the rally from June 2011 low to the July 2011 high, it would put SPY at about 204.00 this week to next week.  But again it may be more sensible to correct for volatility and to understand the tendency for final highs or secondary rallies to double top or fail to exceed an old top.  From a simple chart based standpoint as opposed to measuring in percent terms, the rally off Aug 2007 lows made a slightly higher high for the bull market, basically double topping then declining.  Off the June 2011 low, the rally was more brief and failed slightly below the prior high from May 2011.

So as we now see the QQQ at a new high, and the other indexes still lagging with concurrent divergences still present, I believe it is sensible to expect this move to stall near or slightly above the recent all time highs in SPY.

If prices decline below the recent low from Aug 7th, I think that would be a sign of broad market weakness.  So that could be a line in the sand to watch depending on your holdings and time frame.


Tuesday, August 5, 2014

Recent Spike In Equity Put/Call Ratio Above 1.0

Equity Put/Call Ratio Greater Than 1.0 Instances Going Back To 2009

On Friday the equity put/call ratio spike to 1.04.  That is the first time in 3 years that it has exceeded 1.0.  While the initial contrary analysis of this data point is that the market is excessively fearful, I have a somewhat more complete view to offer, I believe.

What is evident going back over the last 2 bull markets and the intervening bear market is that the ratio spiking like this for the first time in a while may be a psychological point of change which is showing a shift to fear entering into the market that has not been present in some time.  This is the type of market psychology shift that I would expect to see as a market is topping.

If you go back through price charts you will see that the ratio spike has typically first occurred prior to an intermediate swing low forming.  So from this we can expect that the market will likely form a least a slightly lower low, which the S&P 500 did already today.

Secondarily, once an intermediate low did form after these prior instances, there were some sharp rebound rallies.  But notice that none of the clusters (even in the current bull market) marked a lasting low.  After some sharp rebounds, price broke to yet lower lows.  So from this tendency - which has been very consistent - I would expect a sharp rebound here beginning within the next 1-2 weeks, but possibly after a further acceleration to the downside.

Next, all three of the last clusters of readings (Jan 2009, June 2011, Aug 2011) all led to 2-4 week rally attempts with the bulk of the rally happening in the first 2 weeks.  So on this basis it may be reasonable to operate under the template that once we see a rally occur, we can look to short or inverse the stock indexes after a couple weeks.

Going back to the topping of the 2007 bull market high, the current market technical analysis set-up is most similar to clusters of readings above 1.0 that occurred in August 2007 and in June 2011.


  • The rally off the August 2007 cluster led to a slight new bull market high, which double topped in the S&P 500 and led to the final bull market high after 8 weeks, on Oct. 11th 2007.
  • The rally off the mid June 2011 cluster led to a slightly lower high in mid July in the the indexes (and a double or triple top on the Nasdaq 100), followed by a 21% high to low correction in the S&P 500.
So given the technical set-up here, in that we are still near the bull market high in prices, and the bullish psychology is still dominant, and the program trading systems are probably still set to "buy the dip", we may expect a rally back toward the highs on an upcoming rally.  The biggest difference at this point, is that the current decline is very shallow in comparison to the price damage that occurred after those highs.  So unless the decline deepens further, it would seem most likely that a new bull market high could very well occur here.


Click on Chart to Enlarge

This chart is the TOTAL put/call ratio with some analysis on it like I have shown in the past.  The point here is that relative to the recent trend the ratio has spiked to a statistical extreme.  That often at least slightly precedes significant lows, but it does put us on alert that the market may be primed to attempt a rally here.

After a similar spike in June 2013, stocks chopped in an up-down-up fashion for a week or so, before falling down another 3+% below the existing low of the correction.  So given the modest decline so far, and the tendency for divergences to occur at the turns, it may be a reasonable idea to go with here as well if we see stocks immediately start to rally from this point.

So hopefully this look back has been helpful in planning and formulating realistic expectations for upcoming market action.  I would suggest being ready for some further volatility.  And also recognize the significance of a high put/call reading as a potential point of recognition or psychological shift in the markets here.  Assuming that stocks don't fall apart from here - although not a safe assumption - the next rally may be a "last ditch" to exit the market on an investment basis before a broad spread sell-off takes place.  That is my take on it.

Thursday, June 19, 2014

Equity Put/Call Ratio At Multi Year Lows

Click on Chart to Enlarge

The equity put/call ratio put in a very low reading yesterday at 0.38.  And the chart above shows the 10 day average at a multi year low and outside its standard deviation band.  These are further signs building a case that stocks are nearing an optimistic extreme.

The other side of the equation is that stocks are at all time highs and so optimism is warranted here.  As I always point out, it is not the extreme that typically coincides with a high or low.  There is often a period of slowing of market action and development of lesser sentiment extremes which diverge with continued price highs that are the better indication that the time window is narrowing in on a trend change.

From extensive experience monitoring these ratios, my opinion is that extremes like this are good places to reduce positions.  In these cases, sell out partially of the market.  It is true that sometimes trends only pause and your stocks will continue to move big.  So that is why I always hammer home the idea that a trailing stop or stop adjusting mechanism be used to allow for major winners to continue.  So the idea is that when the market is at a sentiment extreme, often most of the move is done, and whatever gains come from here, will often be given back and then some at the next correction.  And so even if you partially sell out, you could often buy back the position at a lower price when opposite extreme sentiment conditions show up.