Both silver and bonds have recently spiked into a common type of blow-off top pattern, some off which I have highlighted on this blog in recent years.
Sentiment and large trader positioning is ripe for a trend reversal or stall.
If you are one to get caught up late in a trend when it is obvious, my suggestion is that this trend has run its course. And now is time to exit on an intermediate term basis, certainly NOT to get sucked into what WAS a strong trend.
Pete
Showing posts with label silver. Show all posts
Showing posts with label silver. Show all posts
Thursday, September 5, 2019

Tuesday, November 28, 2017
Silver Breaking Out of Triangle 11-28-17

Click on Chart to Enlarge
Silver has been trading in a very tight range for a couple months. The chart has the appearance of a symmetrical triangle, but has experienced some choppy action at both boundaries of the triangle.
Today there was an obvious close below the lower/lowest boundary of the triangle. This occurred with a marked increase in volume, suggesting a possibly complete triangle formation with further downside action to follow.
The chart above projects some measure type moves based upon the chart and price formation. The early October low would be the bare minimum expected move to the downside. But the 15.00 to 14.50 over the next 1 to 4 weeks would be a reasonable move. That seems like a large move given recent action, but just this calendar year you can see many up and down moves on the chart which of that size or greater.
Tuesday, January 13, 2015
Silver Update
Recently I had mentioned that silver may be set for a directional advance. So far that call has held up well with silver up over 7% in the 2 weeks since that post.
Sow silver is at resistance from the early December high and is at a potential continuation or breakout failure point. My personal opinion here based on the technical analysis is that the breakout will succeed and price will continue to advance in the coming weeks or few months.
While I didn't give a specific trade entry or price, if you took that information and got into silver or are holding silver, and if you would like any input on specific scenarios depending on which option contracts were purchased or where and when stops can be moved on equities or futures, then either comment or email reply to this post and I will try to assist you or create a follow up post.
As a personal note I do have 15 strike SLV options that expire at the end of this week. They have seen some volatility during my holding period by are currently up right around 100%. So I will be vigilant here about watching a potential breakout for deciding whether to hold until the end of the week, or exiting out sooner.
Also I do have some options that expire at the end of January which are 17 strike SLV calls. So they are out of the money, but I got them at 0.13 per contract and they are up about 50% currently. However, time decay erodes them every day here, and so it will take a continued move higher for them to really be the winner I hoped for. Based on some projections I felt that SLV may rally into the $18-19.50 range by the end of the month. That would make for a nice potential gain. Given the significant OTM position at entry, it is a small position that can afford to lose all of its value. But it has the potential for a big % gain, and so I am planning on holding until expiration or until the weekly %K stochastics goes above 80 at which point I will immediately exit the position. That only gives me 2.5 weeks for that to happen, but it is still possible if moving above the December high creates some short covering or new significant buying. That scenario could easily boost silver 10% or more in just a couple days.
Pete
Sow silver is at resistance from the early December high and is at a potential continuation or breakout failure point. My personal opinion here based on the technical analysis is that the breakout will succeed and price will continue to advance in the coming weeks or few months.
While I didn't give a specific trade entry or price, if you took that information and got into silver or are holding silver, and if you would like any input on specific scenarios depending on which option contracts were purchased or where and when stops can be moved on equities or futures, then either comment or email reply to this post and I will try to assist you or create a follow up post.
As a personal note I do have 15 strike SLV options that expire at the end of this week. They have seen some volatility during my holding period by are currently up right around 100%. So I will be vigilant here about watching a potential breakout for deciding whether to hold until the end of the week, or exiting out sooner.
Also I do have some options that expire at the end of January which are 17 strike SLV calls. So they are out of the money, but I got them at 0.13 per contract and they are up about 50% currently. However, time decay erodes them every day here, and so it will take a continued move higher for them to really be the winner I hoped for. Based on some projections I felt that SLV may rally into the $18-19.50 range by the end of the month. That would make for a nice potential gain. Given the significant OTM position at entry, it is a small position that can afford to lose all of its value. But it has the potential for a big % gain, and so I am planning on holding until expiration or until the weekly %K stochastics goes above 80 at which point I will immediately exit the position. That only gives me 2.5 weeks for that to happen, but it is still possible if moving above the December high creates some short covering or new significant buying. That scenario could easily boost silver 10% or more in just a couple days.
Pete
Thursday, November 6, 2014
Gold and Stock Market Update
As of today, 11-6-14 both gold and silver have triple time frame MACD bullish divergences on the weekly, daily, and hourly charts. So I am keeping a close eye on them for bullish reversals in the price action. Any daily reversal candlestick pattern could be used as entry. Or an hourly chart breakout/momentum signal could be used as well. In these types of cases, assuming a buy signal is given, the stop is placed below the low, and then a portion of the trade is exited by using the hourly chart to give stop movement and/or exit signals. Then a portion is held using the daily chart for signals. I have given ideas on how to trail stops using MACD or moving average channels in the past.
Also for the US stocks, the hourly chart bearish divergence is pretty mature right now, so we are probably very close to a short term pullback in stocks. However, given the strength of the rally and no divergence on the daily chart, it seems unlikely to me that a top of major significance could be made until at least a couple more weeks pass and some daily time frame momentum begins to show divergence.
Also USO/oil prices are showing a very nice daily/weekly dual time frame stochastics set-up today for a long trade. Weekly stochastics is oversold. And the daily is oversold with bullish divergence and made a bullish reversal yesterday. A move above yesterday's high in USO would be a buy signal with a stop below the lowest point of this decline. A currently have an order in UCO to go long on a move above yesterday's high.
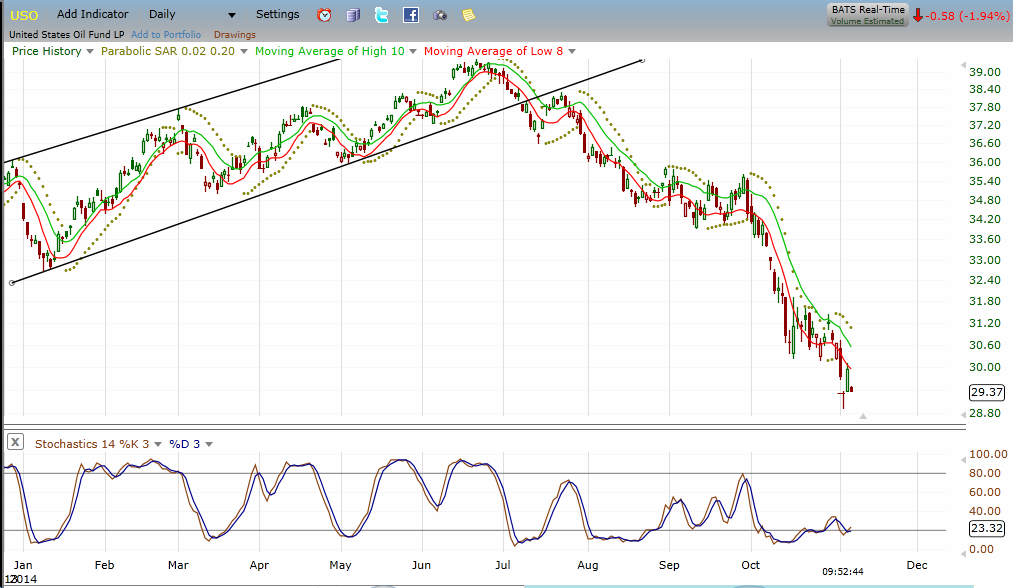
This is USO daily chart showing the stochastics below which has bullish divergence. Multiple commodity markets have the underlying technical and smart money sentiment to stage major rallies.
Also for the US stocks, the hourly chart bearish divergence is pretty mature right now, so we are probably very close to a short term pullback in stocks. However, given the strength of the rally and no divergence on the daily chart, it seems unlikely to me that a top of major significance could be made until at least a couple more weeks pass and some daily time frame momentum begins to show divergence.
Also USO/oil prices are showing a very nice daily/weekly dual time frame stochastics set-up today for a long trade. Weekly stochastics is oversold. And the daily is oversold with bullish divergence and made a bullish reversal yesterday. A move above yesterday's high in USO would be a buy signal with a stop below the lowest point of this decline. A currently have an order in UCO to go long on a move above yesterday's high.
Click Chart to Enlarge
Wednesday, May 14, 2014
Keep Alert For Precious Metals Turning Up - Silver/Gold Ratio

Click on Chart to Enlarge
This chart shows the silver/gold ratio and shows that it has been hitting multi year lows and is near its half year bollinger band. When bull markets take effect typically the silver outperforms and we would expect to see this ratio rise. Also, just from a statistical standpoint, when these strongly correlated metals show a ratio far from the mean, it may be a time to consider a pairs trade - in this case long silver, short gold as a conservative speculation.
However, in context it appears that this is further confirming evidence that the precious metals as a whole may be forming a bottom and be ready to turn up very soon. Historically June is the seasonal low time frame for gold, and with all factors taken into context, from my perspective, we could be seeing the seasonal low here now.

Click on Chart to Enlarge
This chart shows July silver futures and shows a move below the winter lows and now a reversal higher. This type of stop running happens frequently before major advances. Even going back a year, the July contract just slightly broke below the June 2013 low, but the cash silver and SLV etf have not. These types of non-confirmation between futures and cash or near and distant futures contracts also can be flags that trends are about to shift.
Whatever, your trading methodology is, my suggestion is to keep GDX and SIL on your near term watchlist for longs and also look at other individual stocks in those sectors, or even just stick with GLD and SLV etf for speculative trades.
Monday, July 22, 2013
Gold and Silver Rally to Continue? Projections If So

Click on Chart to Enlarge
This is a chart of silver prices going back a few years. I had recently mentioned in video updates that the smart money commercial traders were buying heavily into this market compared to historical buying/selling patterns. They have not turned net long yet, but these producer dominated markets rarely get even close to net long. So the current near net long exposure we are seeing is very extreme in its own right.
Based on seasonal patterns, the common time for gold and silver to form a bottom is the June/July time frame which coincident with the recent swing low in prices. The leg down since last fall has been tremendous in both % decline and time duration compared to historical precedents. This favors at least a relief rally in the metals if not a bear market bottom.
The chart above shows some historical comparison projections of the expected price and time of this rally if it is to continue to unfold into a typical bear market rally or even a first leg up in a new bull market. In either case, we can expect some significant more buying to come in to even reach a minimum expectation. So this would favor being on the lookout for short term buying patterns or signals to continue to follow this rebound up for several weeks.

Click on Chart to Enlarge
This is a weekly chart of gold showing an extremely oversold MACD. Obviously with such an oversold environment a multi-month rally should probably be expected. However, notice that there is no divergence pattern indicating the typical bottoming signal at this time. At most major market bottoms, we see price make a lower low after a rebound from extreme oversold conditions. But the technical indicator (MACD, RSI, momentum, etc.) will not make a lower low. That is our usual tip-off that a bottoming set-up is present.
So given the overall context here, I would be looking for higher prices over the coming weeks, but with the tentative expectation that the rally may lead to another shorting opportunity and move to at least slight lower lows before a possible completed bear market.
Monday, April 15, 2013
Stock Market Update - Gold and Silver Bear Market
4-15-13 Stock Market Update
This video is accidentally split into 2 parts. It covers stocks, bonds, gold, silver, oil, and the US dollar index.
Sunday, December 18, 2011
US Dollar and Gold Update

Click on Chart to Enlarge
See chart above for notes on gold. All data confirms a major breakdown occurring in gold. We are likely to see sharply lower prices in coming weeks. I would anticipate at least to the green circle area by Jan options expiration.
Historically, bull markets such as the current gold and silver bull markets, are likely to retrace around 85% of the bull market on average within 2 years. This is taking it from the 2008 lows. So, that gives us some reference points that these are likely headed much lower. How long it takes, I think probably not 2 years in this case, but we will see.

Click on Chart to Enlarge
The US Dollar Index is confirming commodities should continue down. Watch for this to heat up quickly.
If there is a factor that keeps stocks from the typical positive seasonality over the next couple weeks, I believe it is the precarious position of gold and the corresponding breakout in the US Dollar Index. I would not dabble on the long side here.
Friday, December 16, 2011
SLV Trendline Break

Click on Chart to Enlarge
The SLV etf is shown above. It gapped from above its 2008-2011 bull market trendline to below the trendline with a large gap down on Wednesday. I noted a similar thing in gold on Monday. When trendlines are broken with large gaps, that is typically significant. Everything still indicates this is headed much lower. From my study of how these things go, I would expect the market to correct at least down to the beginning of the final "blow off" leg up of the bull market. That would be around 17.50 at the mid 2010 consolidation level.
With options expiration today and metals set to gap up up today, I don't expect downside today. We may see a move back up toward the trendline on SLV today for a backtest of the trendline. But I would expect continuation downward next week.
Subscribe to:
Posts (Atom)