Showing posts with label ATR. Show all posts

Wednesday, March 25, 2020

Post "Crash" Rebound Projections for SPY - March 25, 2020

 Click on Chart to Enlarge

This chart of SPY shows what are some projections for a continued advance over the coming weeks if the recent lows holds.

This is based on rebounds following some sharp declines into 52 week lows over the last couple decades.

The blue lines represent average MAX gains over 3, 5, 10, and 21 trading days in terms of ATR multiples which bases the projection upon volatility.

That being said, none of the instances in the table below actually gained more than about 23% over the following 1 month.  23% from the recent closing low would put SPY at around $273 which is what the red line represents.

In the comparable past instances a trailing stop of 2 or 3 times the 10 day ATR allowed the gains of the following rally to be captured.  The ATR would be anticipated to shrink as the rally continues and volatility shrinks.  So that is a wide stop now, but could shrink considerably by 2-4 weeks from now.

Click on Table to Enlarge

This table shows the dates of the comparable lows that I am making projections off of.

Click on Chart to Enlarge

The chart here is just for historical context in that the 2 most similar historical precedents to our current environment were 1929 and 1987.

1929 had a more sharply angled and less choppy advance that retraced 50% of the crash losses before rolling over again.

1987 had a quick couple day rebound of 15% followed by a sloppy trading range for a year.


Pete

Friday, February 28, 2020

Continued Extremes Suggest Imminent Sharp (Short Term) Rebound In Stocks - 2/28/20

Some key data points from today are:


  • 4 closes in a row below the lower bollinger band on SPY
  • 4 closes in a row above the upper bollinger band on VIX
  • 2 period cumulative WRSI2 less than 1 

The past history of SPY demonstrates extremely strong (~100%) past history of a high close than the trigger day within the next 5 days.

There was very strong tendency for the next day to close higher.

Also, today was 2 days in a row with gap downs more than 1%.  This also has led to strong rebounds.
  • I looked at what happened in past times where the 1st gap down was NOT filled.  And even though prices went dramatically lower the second day, past similar instances suggest around a 50% probability of the 1st gap being filled within the next 5 days.
  • That would put price back up at 311 on SPY.
From the most extreme similar instances, the MAX gains over the next 5 days were mostly clustered between 2.25 and 3.5 ATR's (10 period).
  • This would suggest that the maximum gain over the next 5 days could be a very sharp rise to between 310-320 on SPY.
  • The large gap down from Thursday is currently only 2 ATR's above Friday's closing price, so it seems that that gap fill would be a good target for this rise.
  • Assuming we saw a rise and a close above the gap level at ~311, I think that would be an ideal exit time if it occurs.

Pete

Wednesday, December 4, 2019

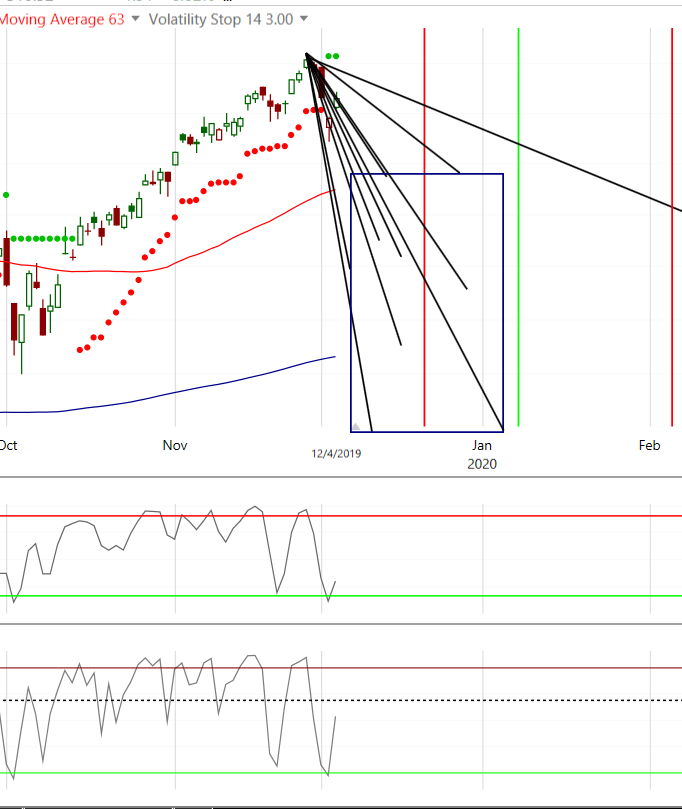
SPY Downside Volatility Breakout - Projections for Potential Decline Into Early January 2020

Click on Chart to Enlarge

Yesterday SPY closed below a trailing 3 ATR volatility stop.  I looked back over the last few years at the decline from high to low the other times the volatility stop was broken.

I excluded a few in the middle of 2017.  That market environment was exceptional/historic momentum.  A few breaks that year were smaller than the average on this chart, but for our purposes I am just showing a range of expectation.

So from the precedents here, it seems likely that price would retest the recent highs from September, and possible decline well below that before the correction is over.

As long as price stays below the recent highs, I would anticipate possibility for a sharper sell off into the new year.


Monday, August 5, 2019

Short Term Rebound is Highly Probable over Next 3-5 Days in SPY ; Longer Term, BEWARE 8-5-19

Click on Chart to Enlarge

There are multiple short term extremes showing up right now indicating high probability of a short-term rebound in stocks.

Based on multiple back-tests of different data sets (price, volatility, put/call ratios), I would estimate the probability of a close above today's close within the next 5 trading days to be about 90%.

The chart above shows the average price action over the next 3 days in terms of 10 day ATR. 
These projections are based upon the price set-up of 3 consecutive closes below the lower bollinger band on SPY.

  • The average close 3 days ahead has been about +0.9 ATR.
  • The average maximum gain over the next 3 days has been about +1.85 ATR which would put price up around yesterday's low.
  • The average maximum loss over the next 3 days has been about -1.0 ATR which is about 4.00 on SPY currently.
  • Also of note, for the same set-up, 50% of past instances filled the gap open down within the next 3 days.  So about 1/2 the time we could expect SPY to trade back up to 292.62 or higher within the next 3 days.

Now, on a longer term basis this looks very much like a bull trap topping process, and there are multiple long term price and sentiment divergences to suggest that a bull market high could be in on this recent failed breakout to new highs.

My personal stance is to continue to trade with a bearish perspective as long as new shorter term technical sell signals occur below the recent highs.


Pete