Showing posts with label SPY. Show all posts

Wednesday, October 12, 2022

Stocks Appears Set For A Rebound Attempt (but probably more choppy volatility in the next few weeks) 10-12-22


Click on Chart to Enlarge

Currently stocks are in an interesting position.  SPY and QQQ hit new 52 week lows, but small caps and NYSE did not.  

There is a stark bullish divergence in breadth (Mclellan oscillator, etc).  

So between the non-confirmation and bullish divergence in the internals, it appears possible for a substantial rebound to occur soon.

However, on a pure price backtesting basis I have looked at different criteria combinations as price makes a 52 week low, and the results are NOT universally lopsided to the bullish side right now.


However the above shows the case where a 52 we lows is made with 4 or more closes down in a row.  I was a little surprised to see how bullish the skew was over the intermediate term.  So in the past that type of action has been somewhat exhaustive selling pressure.  So this is a bullish argument.


Click on Chart to Enlarge

This table shows times when both the 14 period RSI was in a bullish divergence at a 52 week low AND then 2 period RSI was less than 10.  So it incorporates a longer term extreme sell off and loss of momentum with a shorter term extreme sell off.

Again the results here are bullish, but the skew is more notable in the first 3-10 days.


I am not going to post other data here, but in the longer term a new 52 week low is a bearish skew as it confirms the downtrend.

And without a low or close below the bollinger band, a 52 week low is not as notable for a bullish rebound.


I have elected to highlight the bullish studies above, because on the balance of everything I am looking at, it appears the next 5-6 days would more likely be bullish than bearish.   But I do not view it as an extreme high probability occurrence right now.


Tuesday, September 27, 2022

Stocks Are Set Up for a Sharp Short Term Rebound 9-27-22


Click on Image to Enlarge

This table shows the history of SPY when the previous day RSI2 was less than 2 and today makes a 52 week low.  So basically price was already oversold to an extreme level, and then makes a 52 week low the next day.  The implication is high probability (90%+) of a high close within the next 5 days.


Click on Chart to Enlarge

This is an hourly chart of SPY showing a stark bullish divergence on the MACD at today's lows.  While I don't have a way to back test the significance of this, but in conjunction with the daily time frame price action, this shows a set-up where a 15-60 min chart could be "stalked" for a technical entry signal, with  a stop below the low.  


I any case it shows that momentum may be slowing, which is typical before a rebound.


Just a longer term note.......there is extreme fear and correlated selling in markets right now by many measures.  I have seen many indications that buying and holding for a year from the current levels would have a high probability of success based upon historical precedents.

Thursday, May 5, 2022

Probable Continued Sell Off in Stocks 5-5-22

Click on Table to Enlarge

It is very rare to have any combination of underlying price factors which produce an extreme negative skew in forward returns in my experience.

But based upon today's market action I looked .....

Criteria:
  • Yesterday SPY was up >2.5%
  • Today is down more than 3%
  • Price is below 200 day moving average
This basically shows a big flip flop in price in the context of a down trend.  

There are not many instances, but the past instances show a high probability of a continued decline with a 4:1 maximum loss compared to gain over the next 5 days.

There was also a high probability of 2 or more closes down in a row over the next 5 days.

9 out of the 11 instances showed maximum losses of over 4.9% or greater over the next 5 days.  

This scan was not adjusted for volatility.  So understand that there could a large increase in volatility over the next few days.


Thursday, February 24, 2022

Panic Selling In SPY Suggests A Bullish Short Term Trade Opportunity 2-24-22


 Click on Table to Enlarge

The current sell off in SPY has reached a panic level that puts it in an elite class of sell-offs.

While fear is very high like it is now, it often FEELS very risky to buy stocks.

And certainly prices could go lower.

HOWEVER, the points of very high fear are often the greatest points of short term opportunity to go against the crowd.

The above table shows evidence of this.  That shows past instances in SPY when:

  • Gap down is more than 2%
  • The last 3 days were down previous to the gap down
Note the huge return from columns AK and AL,

This strategy would be buying at the open today and then selling at the close tomorrow or the following day.

In addition, in these past instances there was 100% chance of a higher close within the next 5 trading days relative to the close TODAY.

Now since volatility is very high, and there are no guarantees, the question here is not so much whether the odds favor a short term buy.  They clearly do.

The question is risk management and How Much? to buy.

If not using stops, then bullish option spreads or a naked call option could be used.

If going long the equity, then I like to use the leveraged ETF like SPXL but only use a portion of the account.  This should really be part of a defined plan.  


For fun here......if you are reading this, do you think prices will rebound and make a higher close within the next 5 days?

Or do you think this time is different?

Comment either way if you have an opinion!

Pete

Wednesday, March 25, 2020

Post "Crash" Rebound Projections for SPY - March 25, 2020

 Click on Chart to Enlarge

This chart of SPY shows what are some projections for a continued advance over the coming weeks if the recent lows holds.

This is based on rebounds following some sharp declines into 52 week lows over the last couple decades.

The blue lines represent average MAX gains over 3, 5, 10, and 21 trading days in terms of ATR multiples which bases the projection upon volatility.

That being said, none of the instances in the table below actually gained more than about 23% over the following 1 month.  23% from the recent closing low would put SPY at around $273 which is what the red line represents.

In the comparable past instances a trailing stop of 2 or 3 times the 10 day ATR allowed the gains of the following rally to be captured.  The ATR would be anticipated to shrink as the rally continues and volatility shrinks.  So that is a wide stop now, but could shrink considerably by 2-4 weeks from now.

Click on Table to Enlarge

This table shows the dates of the comparable lows that I am making projections off of.

Click on Chart to Enlarge

The chart here is just for historical context in that the 2 most similar historical precedents to our current environment were 1929 and 1987.

1929 had a more sharply angled and less choppy advance that retraced 50% of the crash losses before rolling over again.

1987 had a quick couple day rebound of 15% followed by a sloppy trading range for a year.


Pete

Monday, March 9, 2020

3-9-20 Stock Market Update and Expectation

The snips here show the results of a scan on past instances in SPY when it was down more than 6% in a day.

SPY only goes back to the mid 1990's, so it is short sighted in terms of history, BUT the data does include a couple of the largest bear markets in history, so it could give us some useful guides.

The implication is that there is about a 2.6:1 greater upside potential over the next 3 days compared to downside.  This is quite strong.  Note that basically all past instances increased 5% or more at some point over the next 3 days.

The lower table shows that all instances made a positive close above the signal day (today) over the next 5 days at some point.  But all of them also showed 2 higher closes over the next 5 days.
And that strategy has given the higher return compared to exiting on the first positive close.

Also note that all prior instances declined at least a little, tiny bit further over the next few days.  In fact looking at the next day's data only (not shown here), all of them made at least a slight loss during the next session.

So the point here is that this is an exceptionally volatile market, but is presenting an exceptionally high reward over the very short term.  If not in the market, a simple strategy would be to enter tomorrow at a limit of today's close.  

Then exit at the first positive close or second positive close OR after 5 days if not profitable.

Average future return peaked at a 5 day hold on this set up.

That also fit with short term cycles which suggest a 3-4 day short term advance is due.  But after than, there may be further downside or retest of the lows.


Wednesday, December 4, 2019

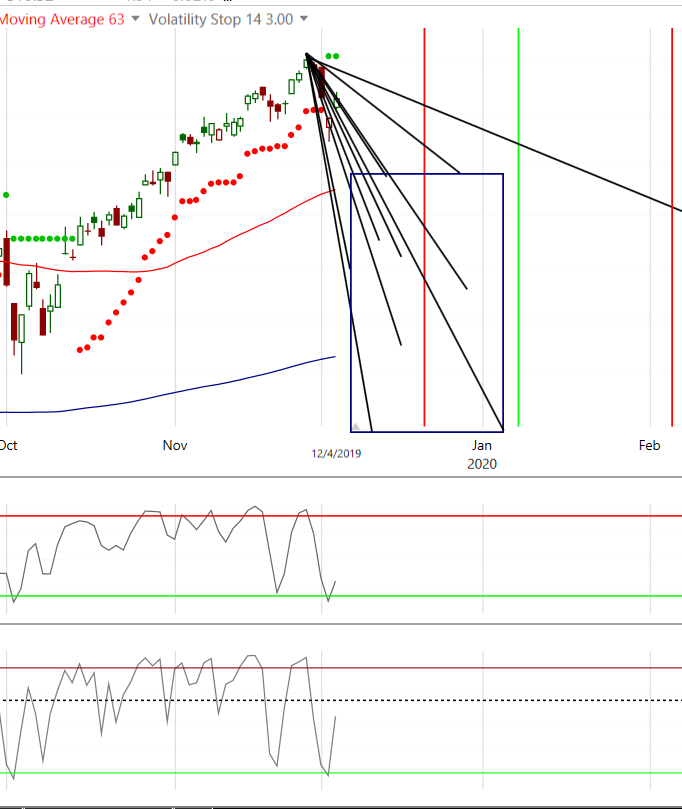
SPY Downside Volatility Breakout - Projections for Potential Decline Into Early January 2020

Click on Chart to Enlarge

Yesterday SPY closed below a trailing 3 ATR volatility stop.  I looked back over the last few years at the decline from high to low the other times the volatility stop was broken.

I excluded a few in the middle of 2017.  That market environment was exceptional/historic momentum.  A few breaks that year were smaller than the average on this chart, but for our purposes I am just showing a range of expectation.

So from the precedents here, it seems likely that price would retest the recent highs from September, and possible decline well below that before the correction is over.

As long as price stays below the recent highs, I would anticipate possibility for a sharper sell off into the new year.


Thursday, October 3, 2019

High Probability Set Up In Stocks - Short Term Rebound Expected 10/3/19

SPY has closed below its lower bollinger band for 3 days straight.  That itself produces a robust signal with high probability of short term skew to the upside in stocks in coming days.

Factoring an uptrending market into it improves the signal.

Also as of today we are seeing some extreme readings in the put call ratios.  I have looked at these readings coupled with a variety of other combinations of data from today's session, and there consistently is a high probability of a higher close in coming days.

There is approximately 90% probability of a high close than today's close within the next 5 days.  Including any losers, the average trade return is quite good - depending on the scan combination, around 1% expected value or higher.

Most of the scan combinations I looked at had higher expected values by holding for either 2 consecutive higher closes OR two higher closes within the next 5 days.  This strategy dropped the win percentage down to the 80%+ range but produced a higher expected value on most criteria combinations.

In summary, I expected some chop and volatility into next week, possibly with lower closes yet to come, but the odds appear to be high for a higher close above Thursday's close within the next week.

Monday, August 5, 2019

Short Term Rebound is Highly Probable over Next 3-5 Days in SPY ; Longer Term, BEWARE 8-5-19

Click on Chart to Enlarge

There are multiple short term extremes showing up right now indicating high probability of a short-term rebound in stocks.

Based on multiple back-tests of different data sets (price, volatility, put/call ratios), I would estimate the probability of a close above today's close within the next 5 trading days to be about 90%.

The chart above shows the average price action over the next 3 days in terms of 10 day ATR. 
These projections are based upon the price set-up of 3 consecutive closes below the lower bollinger band on SPY.

  • The average close 3 days ahead has been about +0.9 ATR.
  • The average maximum gain over the next 3 days has been about +1.85 ATR which would put price up around yesterday's low.
  • The average maximum loss over the next 3 days has been about -1.0 ATR which is about 4.00 on SPY currently.
  • Also of note, for the same set-up, 50% of past instances filled the gap open down within the next 3 days.  So about 1/2 the time we could expect SPY to trade back up to 292.62 or higher within the next 3 days.

Now, on a longer term basis this looks very much like a bull trap topping process, and there are multiple long term price and sentiment divergences to suggest that a bull market high could be in on this recent failed breakout to new highs.

My personal stance is to continue to trade with a bearish perspective as long as new shorter term technical sell signals occur below the recent highs.


Pete

Monday, January 14, 2019

0.5% Gap Downs 3 Days In a Row

There have been 3 days in a row of 0.5% or greater gap downs in SPY as of today.  Action after the open has been relatively tame with no big down days.

Without factoring in any other data, just looking at the 3 gap downs in a row, there were 26 instances in the history of SPY (back to late 1995).

19 closed above the open on the day, with an expected value (including losses) of a little over 1%.

Also, 20 out of the 26 filled the gap down of the most recent day (today in this case) within the next 2 trading sessions (by Wednesday in this case).


The flip side of this is that, there are some signs that suggest a pullback is probable.  So I am looking to make an inverse trade on the index ETFs.  But the data above suggest we may anticipate a fill of today's gap before considering an inverse position.

I am monitoring the 30 min and 60 min SPY charts with a 3.0 volatility stop as an entry signal for a short/inverse trade.

The above data also basically fit with what I am seeing from time cycle analysis.  Short term the cycles are up until Tuesday/Wednesday, than are turning lower into next week.


Pete

Wednesday, December 26, 2018

SPY Closes Below Bollinger Band 4 Days In a Row - Implication is STRONG For a Rebound In the Next 3-5 Days


Click on Tables to Enlarge

As of Monday, SPY had closed below the lower Bollinger Band for 4 days in a row.  This is a rare occurrence.  And it has closed below the lower band for 5 out of the last 6 days.

This set up is one of the strongest I have ever filtered for in terms of short term skew towards the upside.  The stats above show about a 4:1 greater MAX gain to MAX loss over the next 3 days.

That being said, as today is indicating a gap up, some of that potential gain is gone if buying at the open.  However, gap ups after these signals, on average, lead to further gains from the open.

So while we have had some other signals in the past week which have often led to short term rebounds, and this time the sell off continued, the indication here is that some reversion to the mean is likely to occur in terms of trading systems.

Click on Table to Enlarge

This little table shows dates on an amalgamation of filtered signals that I have noted to have positive short term skews in the past.  There will be a number of duplicates that are not removed in this sample, but the indication is clear.

There is over a 90% probability of a higher close than the signal day within the next 5 days.  And nearly a 2% expected value if buying at the close of the signal day, and exiting at the first profitable close in the next 5 days, or just exiting at the close 5 days later if not.

I like this type of strategy for directional option trading.  There is high probability of success, the expiration date is clear, and no stop needs to be used (depending on how deep ITM the option is and your risk strategy).

Because volatility is high and much of the option value can be sucked out if trading close to the money, some ideas are to trade deep ITM (like >0.90 delta), or to buy an option with 2 weeks until expiration, but keep the same exit strategy within 5 days.  That way, not all the time value will get sucked out even if the exit doesn't come for 5 days.

Thursday, December 20, 2018

Back to Back Closes Below Bollinger Band - Both Down 1% or More

First my post from yesterday contained what appears to be an error in that End of Day data showed the VIX unchanged and I had stated it was down 2%.  My hourly chart data showed the close down 2%, but the daily chart data showed it unchanged. 

That being said the market continues to appear to be very near a short term capitulation and brief rebound.

I ran a filtering of the last 23+ years of SPY data and looked at:


  • 2 closes in a row under the lower bollinger band
  • Both days were down more than 1%
The results were 35 instances.  33 of them had a higher close within the next 5 days.  
If entering at the close of the signal day (today) and exiting at the close of the first higher close within the next 5 days, or exiting at the close of the 5th day if there were no higher closes, then the EV was 2.37% gain.

So the odds appear to favor an rebound rally in short order.  I would caution, that this does not mean the decline is over.  And a sharp rally for a couple days could be a lower time frame short set-up for another move lower.


Thursday, December 6, 2018

Some Stats For Current Market Action

This morning I looked at several combinations of factors in the current market compared to past market data.  I will provide a few close estimates here and give an idea for a profitable course of action.

There is about 40% chance of today's gap down filling today
There is about 60% chance of today closing above the open

Given today's gap down in SPY of about 1.6% I look at what happened if SPY closes down more than 1%

Scan Criteria
Yesterday closed down 2% or more
Today gapped down 1% or more
Today closed down 1% or more

When I ran this scan, I got 19 instances back in the past 23 years.  All of them showed basically 100% loss of premium if selling an ATM put at the close with 5 days until expiration. 

So the market on average rallied significantly, and with elevated volatility it was a good time to sell options versus buying options.

Trade Idea
If today closes down (especially if 1% or more), a bull put credit spread with ATM strikes could be written with an expiration of next Friday.

Also, cycles I use are suggesting upside into mid December or longer.  And in the above scan, there was a very strong expected value by holding for 8-10 days from the close of the signal day

So a Dec 24th SPY expiration could be used as well for an ATM bull put credit spread

Thursday, October 18, 2018

VIX/VXV Ratio Study Suggesting a Rebound Into Next Week 10-18-18

The VXV (3 month volatility index) does not have a real long history, but has data going back about 8 years or so.

Today the VIX/VXV ratio closed a bit above 1.0 which is a theoretical imbalance in the ratio as the VIX is shorter duration and typically has lower volatility.

I ran a scan to look at the following:

  • VIX/VXV > 1.0
  • SPY closes down 1% or more
  • Price is NOT at a 10 day low
So the idea here is that the volatility remains elevated with a sizable sell off, but price is NOT breaking to lower lows.  I wondered whether price being above recent lows had any difference in the past compared to price falling to new lows.

The data suggests a significant positive skew in the next week price action for the scan noted above.  
Compared to price making a new 10 day low on the day, our current conditions had both higher closing price action moving forward as well as a larger positive skew in MAX GAIN to MAX LOSS over coming days.

There was no positive skew in MAX GAIN to MAX LOSS over the next week when price was declining to a 10 day low with the other conditions listed above.

So in the scan above, 23 instances were returned, and in 20 of them, my option price model shows that the ATM put lost over 90% of its value by expiration 5 days forward.

This data suggests that currently there is an opportunity to sell premium or write a bull put spread with expiries either next Wednesday or next Friday as the data on both would be about the same.

I did write a credit spread near the close today with expiry of next Friday.


Pete

Wednesday, October 17, 2018

Market Pop and VIX Drop Suggests At Least Some Continued Bullish Trade - 10-17-18

I ran a few scans today on SPY past history looking at similar market conditions to the current one:

One simple scan is:
  • VIX declines 15% or more
  • VIX closes below 20
  • SPY gains more than 1%
Going back to 1995 that left 24 instances which matched Tuesday's action in that fashion.

Out of those 24 instances only 6 had a MAX loss of 1% or more in the next 3 days.

The average closing price gain a week later was 0.71% with over 2/3 of instances being positive.

Only 3 out of the 24 shows closing losses of 1% or more 1 week later.

But 10 instances out of 24 showed closing gains of 1% or more 1 week later.


It wasn't an incredible put selling opportunity, but about 75% of the past instances showed 70% or greater loss in the ATM put at expiration 1 week later.

The average VIX close 1 week later was down about 5%

From looking at past instances of big VIX spikes (like +33% or more), once it was done there were significant rallies in almost all case.

I would expect SPY to close between 275 and 285 next Wednesday (2 weeks out from the VIX spike) based upon past similar instances.


So the outlook here is for some continue short-covering to be probable for a week or so.

Currently active time cycles on SPY suggest that there is upwards bias on the cycle until the middle of next week, which is why I am focusing on the 1 week time frame here.

After that, time cycles turn down until about November 5th-6th.


So my plan here is to continue to hold some option credit spreads that I recently sold with reasonable of collecting full value of the credit next week.

Then it would be a time to consider purchasing a Nov 7th put or sell a bear call credit spread if prices do rise into next week.


Pete

Thursday, October 11, 2018

Stock Market Volatility - Big Pop or Big Drop Ahead? 10-11-18

I have spent considerable time today comparing current market conditions with past data in order to guide expectation and strategies for trading.

MOST of the extremes in VIX, put/call ratios, multiple gaps downs and back to back down days or down streaks have in the past led to strong short term rebounds with peak gains coming at 4-8 days later.  So I think it is possible and reasonably probable that stocks rally 2-6% over the next couple weeks on a closing basis from today's low.

However, and few of the conditions I looked at which indicate very extreme readings, like 3+ standard deviation from the norm, suggest there is also a real possibility of a short term "wipeout" move which will occur before any rally attempt materializes.

Currently, I would estimate the probability of a 5% or greater decline, over the next 3 days or less, to be around 40%.

There is currently no bullish divergence on the hourly MACD chart of SPY, and given the strength of the decline, I would expect for that to develop before the low is in. 

If there is a gap down tomorrow, then from past similar instances I would estimate that from tomorrow's open there is a 2:1 or greater MAX gain versus MAX loss after the open, with a high probability of a close above the open. 

This data is useful in particular for a Friday where if tomorrow gaps down, we could write an option credit spread ATM or slightly OTM with the expiration at tomorrow's weekly option.

Since volatility is very high, and the odds of a close above the open are well above 50% from past stats (more like 75% from what I am looking at), then this could be a nice time to SELL premium with the limited risk of a bull put credit spread.

I may update tomorrow.


Pete


Wednesday, March 28, 2018

Put/Call Ratio Extreme Suggests That Rebound Attempt Is Imminent - 3-28-18

Click on Stats to Enlarge

The above snip is the result of a scan looking at extreme put/call ratios by a few different measures while occurring in the context of a bull market moving average configuration.  Other conditions were that daily and weekly MACD were pointing down and SPY closed down 1% or more on the day.

That paired the list down to a very bullish subset.

SPY only declined about 1% or a little less this morning, but from short term timing cycles and non-confirmation with the QQQ fund, as well as the above noted study, it seems that the downside could be muted for the coming days. 

I exited the rest of QQQ puts I held.

I entered an April 4th SPY 258 strike call with a limit order of 13.50 to exit before expiration if it occurs, but otherwise exit at expiration next week.


Pete

Tuesday, March 27, 2018

Short Covering Rally - Short Term Expectations 3-27-18

Click on Stats to Enlarge

Yesterday the stock averages gapped up and gained ground from the open in explosive fashion. 

After a period of decline, the question is what this means going forward.

I scanned the history of SPY and looked at times where the prior day closed below the lower Bollinger Band and was down 1% or more, and the current day gapped up 1% or more and made further open to close gains all without making a lower low compared to the previous session.

The above table is the whittled down history of market days similar to Monday going back to 1995 in SPY.

Of note, within the next 5 trading days, 6 out of 8 experienced losses of 3.7% or more relative to the close of the signal day (Monday in our case).

7 out of 8 experienced losses of 1.9% or more relative to the signal day close.

Those numbers are based on intraday figures, NOT on closing figures.  But we can see a clear skew to the downside right away in the past instances.  And on a closing basis, the first day following the signal days did not make much further gain or loss on average.  But the next 2-3 days following that showed about half the instances made some sharp breaks lower to retest the lows.

In going through the charts of the past instances, they all experienced some temporary support after a retest of the lows.  So we may expect that if prices do come back down to challenge Friday's low, that we could see further rally attempt somewhere between there or the February price lows.

Also, note that all the instances in that table were in the context of incomplete bear markets except the August 2015 instance.  So possibly this is a harbinger of a longer term shift???

Click on Stats to Enlarge

Also an extreme total put/call ratio was registered on Friday at 1.53.  The above table shows readings of 1.5 or greater in the past.

Also note the downside skew over the next few days.  Again, while not shown here, the MAX closing loss point is the 2nd and 3rd day after the signal. 

So both of these studies suggest a possible/probable retest of last week's low by Thursday this week or maybe a bit beyond.

That fits well with what I am seeing in time cycle analysis in the Nasdaq, which currently projects a bottom on March 29th which is Thursday.


I will update as action unfolds over the next couple days.  Personally I would be looking only to play clear short term reactions expected to the upside of say 1-2 weeks, with the idea that the longer term trend may have shifted to down already.


Pete

Sunday, March 25, 2018

Chances of a "WipeOut" Move This Week.....

I have scanned current market data from several angles in comparison to the last 22+ years of data in effort to estimate what is likely to occur in the wake of this week's decline and technical set-up.

In short I estimate about 25-50% chance of a wipeout type move occuring by this Wednesday.  By that I am meaning something on the order of 5% loss or more.

Based on the several factors I would estimate that SPY could easily carry down to 247 by April 3-4th. 

Click on Chart to Enlarge

The chart above here shows a typical time and trend channel pattern for a "flat" correction.  This would project a move to the lower trend channel at April 3-4th which would be ~$247 on SPY.
That would be 4-5% below current levels and based on several scans comparing to past similar declines, that would be reasonable in the next 3 days to 2 weeks.

Points of note here are that the hourly chart currently does not have a bullish divergence occurring, so it seems more likely with this intensity of decline, that we will see either a divergence develop or a large capitulation gap down like 2% or more gap down as at least a temporary capitulation/spike low.

Also SPY is perched right at its 200 day moving average as of the close Friday.  As I have noted many times in the past, these key moving average points will typically be met by gap ups with gains after the open shortly after the average is challenged.  We saw a sharp rebound off the average on Feb 9th.  However, the more times price comes down to touch the average, there is implication of weakness and the possibility of a sharp break down in prices.

Part of the idea here is that certain key averages factor into program trading and if the buying thrusts off the average are weak and re-tested, there may be a major break down through the average.  The average and the space below it may be stop loss triggers or even trend following short trigger points and result in a large and sharp price movement.

If we are to see that occur here, the chart concern is that there is not a major chart support region until down at the $240-220 region of SPY which would be a pretty major decline.

From a chart point if prices are to break clearly below the lower channel line of the chart above, it would be indicative of longer term trending action to the downside rather than corrective activity of the bull market.

As a side note but maybe of significance, bond prices have rallied weakly off the recent lows, and as of this coming week, the key time cycles in bonds are peaking and indicate downward pressure into early or mid May.  Given that prices are marginally above MAJOR horizontal support, it seems possible that a major breakdown in prices could occur on a break to new lows for the bear market in bonds.

Thursday, March 8, 2018

SPY Update - Expecting Price to Make Another Move Lower Into April of Beyond

Click on Chart to Enlarge

The above chart is a SPY daily chart.  And back on 2-14-18 I had posted regarding past similar instances of selloffs and rebounds following put/call ratio dual time frame imbalances like we were seeing in January of this year. 

At that time I noted that the subsequent rebounds of the 4 previous noted comparable instances had retraced 50-75% of the initial decline.  And I overlaid the actual % and time gains on this chart as indicated by the lines rising up from the 2-9-18 low.  It is notable that tomorrow will equal the time of the longest rebound out of the previous 4, before the decline began its next move down.  So we may be nearing the time point here where prices could be peaking and another round of hard selling comes in.

The blue box on the chart above represents the range of declines over the next 3 months of the 4 comparable instances following the put/call ratio signal.  The indication here is that we may expect another wave of selling to break the February low.

The cycle analysis of current active cycles indicates upward cycle trends into next week and possibly a bit beyond.  But following that, there is downward cycle activity into mid April or beyond.

Basically at this point I am looking for a risk reward set-up or clear technical divergence to develop to initiate a short/inverse position in SPY or related ETFs.

Another concept that I have discussed many times over the years on the blog is "price logic".  This objectively gauges which direction of market price action is stronger/weaker and infers the direction of the next "strong" market move.  On the chart above we can see that the move down from Jan to Feb was very directional and that the ensuing rebound has only partially retraced the decline in more time than the decline took to form.  The idea here is that the current rebound is a counter trend move to a larger downward trend or formation of at least 3 moves....DOWN-UP-DOWN

The other main possibility that I see is that the Jan-Feb decline is the first move down of a triangular pattern or sideways move, meaning that most all price action would occur within the bounds of the Jan highs to Feb lows.  I view this as a less probable scenario but we will see.


Pete