Showing posts with label GDX. Show all posts

Wednesday, July 26, 2017

Breakout of Falling Wedge on GDX (Gold Miners ETF) - Probable Continued Price Advance in Coming Weeks

Click on Chart to Enlarge

In my last post I gave some perspective that gold and gold stocks would likely move higher in the near term.  And prices have done just that for the last couple weeks.

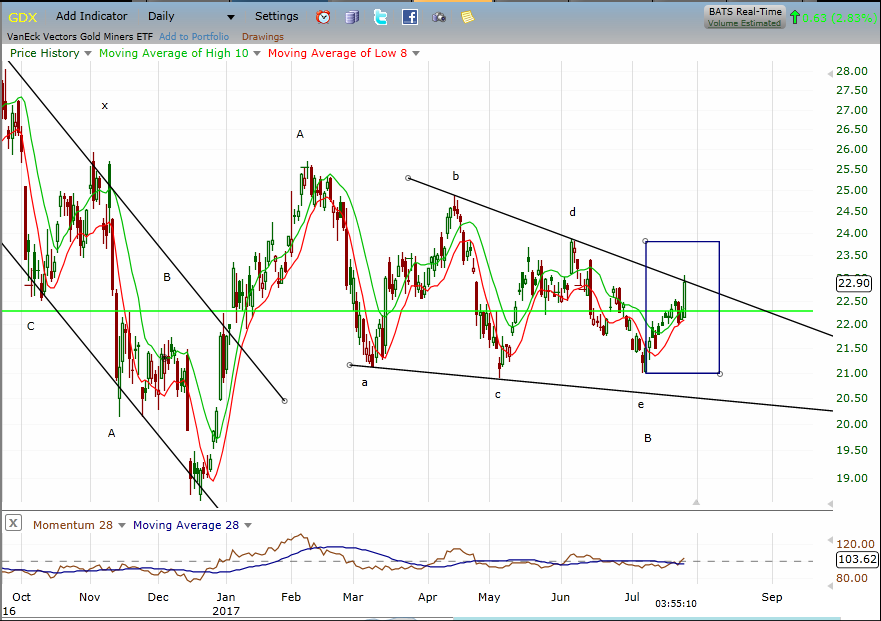
Currently on the GDX etf (shown above), price has moved up and touched the falling boundary line of a falling wedge chart pattern, which I have labeled here as an a-b-c-d-e triangle type pattern.

I'm sure some Elliott wavers would view this progression as an a-b-c-i-ii pattern with the current move up being the early stages of a wave iii, which would be anticipated to be strongly uptrending for a few weeks.

I have put a blue box on the chart to help gauge continued development of post pattern price strength and "price logic".  The idea here is that after a pattern or phase of market action completes, the objective signal of that a new phase has begun is that the last price segment is totally retraced in less time than it took to occur.

In this case the blue box represents the price and time consumption of the d-e move as I have it labeled.  So if that did indeed complete a contracting triangle/falling wedge, then the logical implication is that the current move up will rise above the top of the box BEFORE the right side of the box is reached (in this case that is August 10th).

Now I can't know that it will or won't do that.  But since the price is at a resistance line on the chart and beyond the midpoint of the box, it seems likely that a breakout will occur from the wedge very soon if my perspective is accurate.

It is not uncommon for price to back test a broken wedge line after the breakout occurs.  In this case say price moves up out of the boundary lines of the wedge this week.  Price may come back down to the approximate price level at which the boundary line was exceeded before moving notably higher.


Pete

Wednesday, July 12, 2017

Gold Stocks Possibly Completing Major Basing Pattern 7-12-17

Click on Chart to Enlarge

The chart above is GDX which is the major gold miners ETF.  I will provide here a brief summary of some key factors for analysis but without taking time for further charts.

1.  Commercial traders are the most net long (actually least net short) at any time since near the lows of the gold bear market and at prior lows of legs down in the bear market.  This suggest the potential of a bottom here in prices in a continuing bull market in gold.

2.  The June/July time frame is the annual/seasonal low point for gold historically, and then some of the strongest seasonal move historically is the late summer.  So from this standpoint, it makes sense to look for a low here.

3.  Since early 2016, the CRB/SP500 ratio has been at the lowest point on the chart since 1995.  The prior major trough was in early 1999, after which a major commodity bull market ensued.  So the valuation of commodities to stocks is historically low, and on a longer term basis, could argue for a commodity bull market to be in the works.

4.  I have placed a pattern labeling scheme on the chart of GDX above, which in this labeling scheme, would be the maximum complexity pattern for a correction which can occur in Elliott Wave terms.  Another interpretation that is still bullish would allow for some further decline but without breaking the December low.  On this note, a contracting triangle in wave theory would be common at the end of a complex move as the selling loses steam and a base is formed for a new move.

5.  The bullish engulfing pattern on Monday occurred right at horizontal support and this is a classis bottom reversal candlestick.  This does not suggest the length of any rally, but is further confirmation that a bottom of some degree cold well have occurred on Monday.


I entered long on Tuesday on NUGT which is the 3x gold miners ETF.

The stop is below Monday's low, and I plan a stop movement technique using a moving average channel if prices rise.

Out of individual gold stocks, I really like the pattern on ABX best.


Pete

Thursday, October 1, 2015

Final Exit of SPY Call Option

While I still think the odds probably favor some further upside into next week, I decided to exit the final 1/3 of my position today at the 40% limit level of around 4.10 on the Oct 2nd 189 call.

So I ended up with a 2/3 exit at 40% gain, and a 1/3 exit at ~60% gain.


I am still holding the GDX Dec 13 strike calls.


Pete

Friday, August 28, 2015

GDX Call Option - Gold Stocks Set to Rally Big

Click on Chart to Enlarge

This chart is GDX, the gold miners ETF.  It is showing a very strong bullish divergence in the money flow index, which at significant bottoms tends to be a leading indicator.  See the green circled areas for the last 2 set-ups in the money flow index like this.

Additionally, doing any quick searching on gold seasonal price movements shows the September time frame as a positive trade, and gold is generally strong from Sept through December.

Additionally, the smart money has recently moved to a historically extreme bullish position, suggesting a price support level has been hit at the recent lows in gold.

I plan to enter a December 13 call option on GDX tomorrow.  I am placing a limit order of 1.90 initially.  Currently the ASK is at 2.00.

Once entered I would set a limit order to exit of 6.00 or 300% gain from entry price.