Monday, March 30, 2020

Oil Stock Prices Look Ready to Rebound to Me 3-30-20

Click on Chart to Enlarge

The chart shows oil prices divided by oil stock prices.

Of note, when there have been major spikes lower in this ratio, oil has consistently rapidly rebounded. 

The other instances showed quick gains of 50%+ in 3-6 months in oil prices.

So volatility is high, but the suggestion here is that short term trading systems can go into buy mode here with stops of course.

The chart shows that of the major lows on this chart, most of them lead to major advances of over a year in time.  The early 2015 was a quick 50% rally in oil followed by lower lows, but still a good short term trade opportunity.

Wednesday, March 25, 2020

Post "Crash" Rebound Projections for SPY - March 25, 2020

 Click on Chart to Enlarge

This chart of SPY shows what are some projections for a continued advance over the coming weeks if the recent lows holds.

This is based on rebounds following some sharp declines into 52 week lows over the last couple decades.

The blue lines represent average MAX gains over 3, 5, 10, and 21 trading days in terms of ATR multiples which bases the projection upon volatility.

That being said, none of the instances in the table below actually gained more than about 23% over the following 1 month.  23% from the recent closing low would put SPY at around $273 which is what the red line represents.

In the comparable past instances a trailing stop of 2 or 3 times the 10 day ATR allowed the gains of the following rally to be captured.  The ATR would be anticipated to shrink as the rally continues and volatility shrinks.  So that is a wide stop now, but could shrink considerably by 2-4 weeks from now.

Click on Table to Enlarge

This table shows the dates of the comparable lows that I am making projections off of.

Click on Chart to Enlarge

The chart here is just for historical context in that the 2 most similar historical precedents to our current environment were 1929 and 1987.

1929 had a more sharply angled and less choppy advance that retraced 50% of the crash losses before rolling over again.

1987 had a quick couple day rebound of 15% followed by a sloppy trading range for a year.


Pete

Monday, March 9, 2020

3-9-20 Stock Market Update and Expectation

The snips here show the results of a scan on past instances in SPY when it was down more than 6% in a day.

SPY only goes back to the mid 1990's, so it is short sighted in terms of history, BUT the data does include a couple of the largest bear markets in history, so it could give us some useful guides.

The implication is that there is about a 2.6:1 greater upside potential over the next 3 days compared to downside.  This is quite strong.  Note that basically all past instances increased 5% or more at some point over the next 3 days.

The lower table shows that all instances made a positive close above the signal day (today) over the next 5 days at some point.  But all of them also showed 2 higher closes over the next 5 days.
And that strategy has given the higher return compared to exiting on the first positive close.

Also note that all prior instances declined at least a little, tiny bit further over the next few days.  In fact looking at the next day's data only (not shown here), all of them made at least a slight loss during the next session.

So the point here is that this is an exceptionally volatile market, but is presenting an exceptionally high reward over the very short term.  If not in the market, a simple strategy would be to enter tomorrow at a limit of today's close.  

Then exit at the first positive close or second positive close OR after 5 days if not profitable.

Average future return peaked at a 5 day hold on this set up.

That also fit with short term cycles which suggest a 3-4 day short term advance is due.  But after than, there may be further downside or retest of the lows.


Friday, February 28, 2020

Continued Extremes Suggest Imminent Sharp (Short Term) Rebound In Stocks - 2/28/20

Some key data points from today are:


  • 4 closes in a row below the lower bollinger band on SPY
  • 4 closes in a row above the upper bollinger band on VIX
  • 2 period cumulative WRSI2 less than 1 

The past history of SPY demonstrates extremely strong (~100%) past history of a high close than the trigger day within the next 5 days.

There was very strong tendency for the next day to close higher.

Also, today was 2 days in a row with gap downs more than 1%.  This also has led to strong rebounds.
  • I looked at what happened in past times where the 1st gap down was NOT filled.  And even though prices went dramatically lower the second day, past similar instances suggest around a 50% probability of the 1st gap being filled within the next 5 days.
  • That would put price back up at 311 on SPY.
From the most extreme similar instances, the MAX gains over the next 5 days were mostly clustered between 2.25 and 3.5 ATR's (10 period).
  • This would suggest that the maximum gain over the next 5 days could be a very sharp rise to between 310-320 on SPY.
  • The large gap down from Thursday is currently only 2 ATR's above Friday's closing price, so it seems that that gap fill would be a good target for this rise.
  • Assuming we saw a rise and a close above the gap level at ~311, I think that would be an ideal exit time if it occurs.

Pete

Wednesday, February 26, 2020

Short Term Rebound Is Highly Probable 2-26-20

I have looked at a bunch of different criteria comparing recent action to past history of SPY.

Some key factors that have historically made for short term rebounds include:

  • 2 closes in a row below bollinger bands
  • Back to back 3% down days
  • Gap down of 2% followed by further downside
  • several others....

One very simple scan that triggered today is a 2 day cumulative Wilder's RSI2 reading below 2.
  • The history of SPY had this set-up 27 times (regardless of bull/bear market), all 27 showed a positive close within the next 5 days.  The average gain was large also, as would be expected given the volatility.

I expect a continued volatile market but with a high probability of a short term rebound over the next couple days.

Currently the short term cycle analysis I follow is suggestive that there will be continued higher volatility with probable lower lows over the coming 1-3 weeks.

Wednesday, December 4, 2019

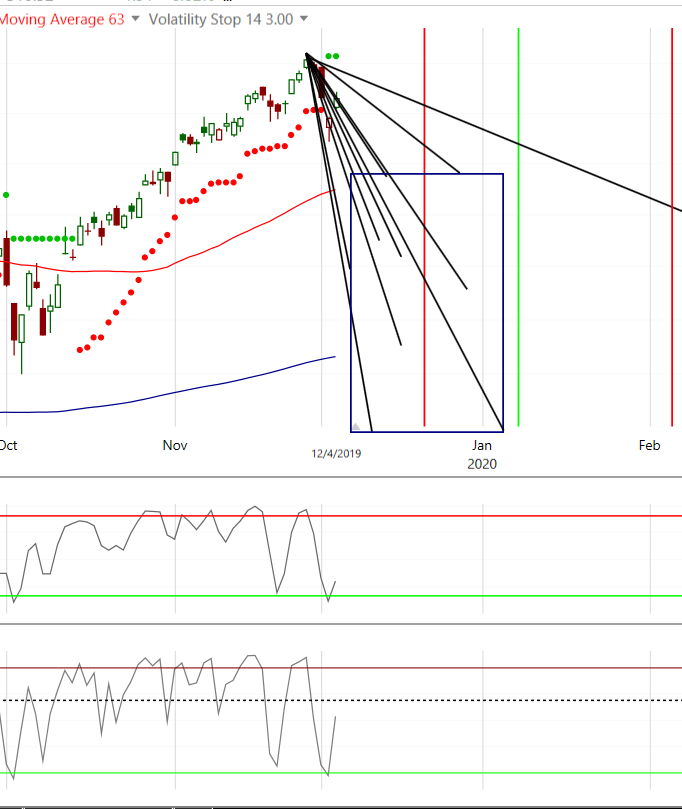
SPY Downside Volatility Breakout - Projections for Potential Decline Into Early January 2020

Click on Chart to Enlarge

Yesterday SPY closed below a trailing 3 ATR volatility stop.  I looked back over the last few years at the decline from high to low the other times the volatility stop was broken.

I excluded a few in the middle of 2017.  That market environment was exceptional/historic momentum.  A few breaks that year were smaller than the average on this chart, but for our purposes I am just showing a range of expectation.

So from the precedents here, it seems likely that price would retest the recent highs from September, and possible decline well below that before the correction is over.

As long as price stays below the recent highs, I would anticipate possibility for a sharper sell off into the new year.


Thursday, October 3, 2019

High Probability Set Up In Stocks - Short Term Rebound Expected 10/3/19

SPY has closed below its lower bollinger band for 3 days straight.  That itself produces a robust signal with high probability of short term skew to the upside in stocks in coming days.

Factoring an uptrending market into it improves the signal.

Also as of today we are seeing some extreme readings in the put call ratios.  I have looked at these readings coupled with a variety of other combinations of data from today's session, and there consistently is a high probability of a higher close in coming days.

There is approximately 90% probability of a high close than today's close within the next 5 days.  Including any losers, the average trade return is quite good - depending on the scan combination, around 1% expected value or higher.

Most of the scan combinations I looked at had higher expected values by holding for either 2 consecutive higher closes OR two higher closes within the next 5 days.  This strategy dropped the win percentage down to the 80%+ range but produced a higher expected value on most criteria combinations.

In summary, I expected some chop and volatility into next week, possibly with lower closes yet to come, but the odds appear to be high for a higher close above Thursday's close within the next week.