Showing posts with label MACD. Show all posts

Tuesday, September 27, 2022

Stocks Are Set Up for a Sharp Short Term Rebound 9-27-22


Click on Image to Enlarge

This table shows the history of SPY when the previous day RSI2 was less than 2 and today makes a 52 week low.  So basically price was already oversold to an extreme level, and then makes a 52 week low the next day.  The implication is high probability (90%+) of a high close within the next 5 days.


Click on Chart to Enlarge

This is an hourly chart of SPY showing a stark bullish divergence on the MACD at today's lows.  While I don't have a way to back test the significance of this, but in conjunction with the daily time frame price action, this shows a set-up where a 15-60 min chart could be "stalked" for a technical entry signal, with  a stop below the low.  


I any case it shows that momentum may be slowing, which is typical before a rebound.


Just a longer term note.......there is extreme fear and correlated selling in markets right now by many measures.  I have seen many indications that buying and holding for a year from the current levels would have a high probability of success based upon historical precedents.

Tuesday, March 13, 2018

Bearish Reversal Pattern With Divergences 3-13-18 Stock Market Update

Click on Chart to Enlarge

The chart above is the Nasdaq composite daily.  It has made a new high above the January highs, and today created a wider range bearish engulfing pattern which is a top reversal pattern potentially.

I view this as potentially meaningful for a number of reasons some already discussed in recent posts, but I will create a short list


  • Significant non-confirmation of other indexes to make new highs
  • VXN touched lower bollinger band yesterday
  • Cycle time analysis turning lower for next couple weeks
  • Dual time frame MACD divergence in Nasdaq (Daily, Weekly)
  • Price touching the top channel line of the high for the bull market 
  • Breadth and sentiment major divergences
I view the risk to be a good bit higher than reward potential for the next couple weeks.

I have an eye on inverse positions or put options here currently.


Pete

Monday, January 15, 2018

Further Signs of Excessive Complacency From Put/Call Ratios 1-15-17

As of Friday's close,there are further signs of a stretched or imbalanced condition in the put/call ratios which suggest that stocks may be within days of an intermediate high.  The table below shows when there is a "sell" signal from the total put/call ratio while the equity put/call ratio is at a longer term complacency imbalance.  I have removed clusters and we are left with some notable tops in recent years.

Click on Stats to Enlarge

I have looked at the data from a few angles including:
  • total put/call "sell" while SPY closes above bollinger bands = BEARISH
  • total put/call "sell" while equity put/call ratio is imbalanced = BEARISH
  • total put/call "sell" while MACD daily and weekly are UP and SPY closes UP = BEARISH
  • total put/call "sell" at a 52 week high = BEARISH

The total put/call "sell" is a 5 day average that is more than 1 standard dev. below the 20 day average.

Also recently there has been a cluster of days where the VIX rises while SPY also rises.  I have looked at the in conjunction with a relatively low VIX/VXV ratio and it is mildly bearish over the next few weeks on average.

Also, I have a "gap indicator" which factors into account cumulative gap direction and relative size and over the last week it reached to an extreme level indicating possible "exhaustion".  I filtered that condition with times when price closed above the bollinger band, and the result is also moderately bearish looking out to about 1 month and then results are typical after that.

Also I looked an example of extreme price momentum in SPY, where the daily and weekly MACD are both positive and in an UP position with no bearish divergence and price has closed above the upper bollinger band on SPY for 2 consecutive days.  Removing the 2018 instances from the last couple weeks, there were not many instances but 3 out of 5 showed sizeable pullbacks of greater than 2.5% over the next 2 weeks.  The negative skew didn't last longer than a couple weeks, but possibly this extreme momentum puts stocks at a spot of probable near term "profit-taking".


So in summary, on a long term basis stocks have historic levels of complacency and indication that the investment crowd is very "one-sided" in the bullish camp, creating a condition of long term risk for stock prices.

On an intermediate term basis, I put the most weight on the put/call ratio studies mentioned above based on personal experience.  And currently, this real money gauge is suggesting a negative skew to forward market prices for several weeks or months.

And in conjunction we have some signs from VIX, gaps, and price momentum, that stocks could be near to a shorter intermediate term correction when comparing to past similar data.


Looking at price cycles currently active in the market, SPY is currently near a peak of the upward portion and from my most recent analysis, the currently active cycles will be creating a downward pressure for several weeks. 


Pete


Friday, May 26, 2017

Further Signs of Intermediate Term Topping and Probable Downside to Come For Stocks 5-25-17

Click on Table to Enlarge

Last week I showed stats from past instances where there was a 1.5% decline in SPY the day after a 52 week high.  And the average displayed a notable bearish skew for the next couple months, though about half of the instances rebounded back to near the highs after that initial big sell off day.

This rebound scenario is what we have seen in the current market.

I have run a couple scans over the last few days, and it still appears that similar past markets have had a notable bearish skew looking forward a few months,

The chart above shows the forward MAX gains and losses from a scan including bearish divergences in VIX, total put/call ratio, volume, MACD and stochastics on daily and weekly time frames.  So basically just an across the board price and real money sentiment bearish divergence.  And the bearish skew is notable for the first couple months.

Another scan criteria looked at unique instances when there was both daily and weekly bearish divergence in the MACD when the VIX closed below 11.  The results were similarly bearish.

There are good trading opportunities here based upon my method and the data at this point.
Based upon past SPY data, shorting here and setting a limit order to cover at 5.75% gain while also setting a 5.75% stop loss would provide a roughly 2.25% expected value over the next month.  The trade would be exited after 21 trading days if neither stop nor limit was filled.

Any where in the 4% to 6% paired limit and stop orders basis SPY would be very reasonable plays.  And 4% the ratio of the risk to the expected value is the lowest, and after that there may be higher expected values with wider orders, but the risk rises more than the expected value increase does.

I am electing to purchase SPXU here and use 12% limit and stop orders.  The simplest way to do this is with an OCO, one cancels the other, order where one order is a sell stop and the other order is a sell limit.  Then set a time reminder to exit on June 26th if neither order is filled already.

For the options side of things, a 130% limit gain order from the closing price yesterday on a 241 strike June expiration put option, would provide a very positive expected value with about a 66% win rate based on past similar instances and the calculation of my algorithm.  For this trade, there is no stop on the option.  It could expire worthless, but a limit gain GTC is set immediately after entry.

Pete

Thursday, May 18, 2017

Stock Market Expectations 5-18-17

Yesterday saw an oversized sell off in stocks compared to the recent low volatility trading.  But as mentioned in the last post a couple days ago, there were indications that a high was to be expected and that stocks were ready to correct.

So the question now is really what the probable future course of action will be.

I have run some backtest scans comparing the current market position to the past trading history of SPY, and I would have to conclude that there is not a clear directional bias based on the past tests.

Obviously the sharp sell off yesterday has a short term bullish perspective when looked at on its own.  But some of the other recent comparisons I've made have shown consistent muted upside for a couple months after the recent really low volatility type readings we've had in the last couple weeks.

Click on Chart to Enlarge

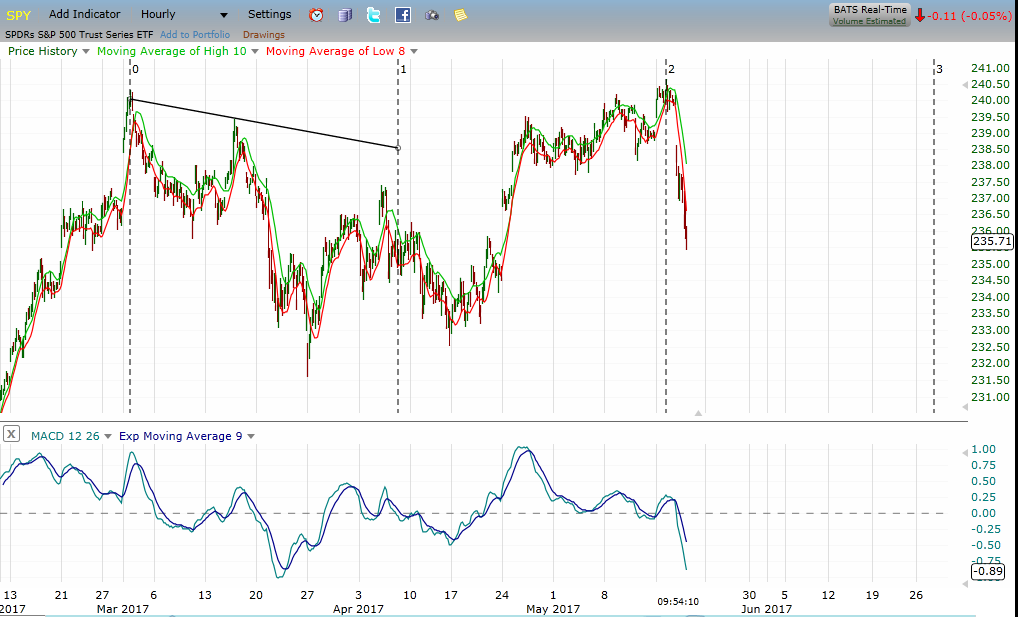
This is an hourly chart of SPY.  And the pattern here, from my perspective would suggest that there is a downside bias through June, with a possible low forming in late June.  And that would fit with a typical correction in stocks.  Historically, a median correction in the SP500 is about 6 weeks and about 11%.  This is for corrections that last greater than 1 month from high to low.

So given that we are in the seasonal "sell" time frame, and the time and structure of the pattern here near the recent high, couple with the technical analysis of weekly time frame divergence on the recent poke to new highs, I will proceed with an outlook that the downside risk still is greater than the upside potential for the next few weeks.

Looking at the MACD in the hourly chart above, we can see that it is "oversold" but with no bullish divergence yet.  I would certainly expect that a divergence will form on this time frame before a nice rally could ensue.  So, it appears that price still have at least some work to do here to the downside before a multi day low could form.


Pete

Monday, January 9, 2017

Multiple Time Frame MACD Divergence In SP500 - Correction Or Bull Market Top Ahead?


Click on Charts to Enlarge

The charts here are the SP500 cash for the top three (monthly, weekly, daily) and SPY for the bottom chart, which is 60min candlesticks.

The monthly, weekly, and daily time frames are all currently displaying bearish divergence at the recent high on Friday.  Given the confluence and time scale of these divergences, I believe that price may be near a crest.  While tops can be sloppy and drawn out, we have already been seeing that for about 2 years.  

Rather than prognosticate on causes and projections and patterns, what we objectively are seeing is a divergence which truly indicates a "slowing" of the trend.  And the divergences so often occur preceding major changes in direction.  So I imagine that like a ball thrown up into the air will gradually slow before it reaches its peak and then begins to travel back down, the rising market will experience progressive slowing down, until it reaches a peak and turns down.  The smaller time frame divergences, I imagine to help identify the finer timing or reaching of the zenith in price.

So much for theories.  But what has happened in the past under some similar circumstances?

I ran a scan on SPY going back to late 1995 where there was a weekly, and daily time frame MACD bearish divergence concurrent with, or within a month after a put/call ratio sell signal like happened a couple weeks ago in the current market.  I also went through and excludes most days after the first signal day if there were a cluster within a 2 week period.

There result is that there was a negative skew in forward return looking out for a couple months.  It was not real lopsided, but in anycase it does support the idea that stocks may be near a relative top.  From a probabilistic standpoint is the only way we can meaningfully approach it for trading.

The skew is not real strong but is most prominent looking ahead about 3 days and at 1 month.  At 1 month after the past signals, the average closing return has been a mild negative at -0.25%.  And the MAX loss has been about 1.3 times the size of the MAX gain.  The numbers here are not strong enough for me to suggest an inverse trade based on those stats alone.  

So there is not a lot actionable here from the trading front.  But for those who want a larger market context for incorporation into trade selection, hopefully this helps.


Pete


Thursday, September 22, 2016

Longer Term Pattern Analysis on SPY ETF - A Major Top Possibly Forming 9-22-16

SPY ETF is Forming a Possible 5th Wave Up and Creating Longer Term Bearish Divergence
Click on the chart of SPY above to enlarge the image.  But there is a pretty nice Fibonacci type sequence developing here.  I have put labels 1,2,3,4 on the chart with an implied 5th wave up to new highs expected using an Elliott wave interpretation.  And if wave 5 is then 38.2% of wave 1, it would project SPY to 225.50ish (projected up from the September low).  Based on the duration and relations of the other price waves, it would seem that the Oct 6th time frame would be a nearly ideal end to the sequence.

From a charting standpoint, the suggested price move in that time frame would lead to a break above the upper channel line of the April to August highs.  And from a technical analysis perspective it could make a massive multiple time frame bearish divergence in the MACD - monthly, weekly, and daily all in bearish divergence.  I have learned that those set ups are significant.  Even if a major top does not end up forming, I would guess there will be a significant correction after such a set up.

From a smart money perspective, we have seen the smart money become aggressive sellers since the move to new highs in July.  Price has not made much headway since then.  If we continue to see increased smart money selling as prices push higher, and price then breaks below the September low, that would be suggestive that the bearish forces have won this battle.

However, when large short positions are accumulated by the smart money, and the opposing players are able to push price several percent above the valuation/battle zone, it may force a short covering by the smart money.  That scenario can lead to major price gains in the market, and often in pretty steady fashion.

But then the scenario is that once the short covering is complete, the stage would be ripe for a major top.  I highlighted such a scenario in 2011 in the cotton market.  Given the large potential "basing period" since May 2015, a short covering rally could take the market much higher.  So I am not hanging my hat on one outcome.

Any short attempted at a quality set up would need a defined stop loss to protect against such a scenario.

But for now, my expectation is that prices will trend higher for the next week or two before another short/inverse set ups "ripens".

Pete

Tuesday, April 19, 2016

Intermediate Term High Likely Completing In SPY 4-19-16

I ran a pretty simple scan today on the history of SPY (going back to fall 1995).  The criteria were as follows:

  • VIX high is less than 15
  • 5/63 day total put/call ratio less than 0.85
  • Daily MACD is in bearish divergence position
The forward returns showed a nearly 2.4 times greater MAX loss versus MAX gain over the coming month.  And buying a 1 month until expiration at the money put option on SPY had a 2 out of 3 chance of at least doubling in price prior to expiration.  So that is a very profitable speculative opportunity to buy the put here and simply set a limit order to exit at 100%.  Let it expire worthless if it loses.  There is no stop.

Also there is a dual time frame (hourly and daily) MACD divergence on today's highs in SPY.  These types of set-ups have been highlighted many times on this blog and often nearly pinpoint a significant turning point for multiday or multi week changes of direction.

So the point here is that SPY is at a lower high than the last intermediate term high in November, and SPY is displaying the type of set up which indicates a completed rally.  So the easy money has been made.  The expected returns for the next several weeks are likely to be flat or negative based on what I have looked at.  

Let me know if there are any questions or specific scenarios you want further info on here.


Pete

Wednesday, March 30, 2016

Daily Time Bearish Divergence in Money Flow Index and MACD - SPY 3-30-16

SPY and Money Flow Index
SPY Overbought Money Flow Index with Bearish Divergence
This daily chart of SPY shows the 50 and 200 day moving averages which are in a longer term downtrend currently (50 day below 200 day) as well as the 14 period money flow index with a 14 period moving average of the MFI.

What is apparent is an overbought MFI with both the raw MFI and the 14 period average in the extreme region.  And now, after a small pullback and MFI (brown line) dipping below its average (blue line), price has moved to a new high, but the MFI is at a lower high creating a classic bearish divergence pattern on this indicator.  This type of pattern has occurred very near to the final price highs before significant pull backs in SPY over the last couple years.

In an up trending market, I'm sure that the end results could be uneventful.  However, given the moving average downtrend configuration, I believe that this signal should be respected as an exit signal for longs.

I don't have a strong opinion on whether the bull market is complete, and a major decline will take place, though given the Commitment of Traders data on the rally up since February, it seems reasonable that this whole rally has been a short covering move with no big money new interest taking place on the long side.

I will look at speculative opportunities on the downside possibility to come from these levels.


Pete

Thursday, December 10, 2015

Update on a Few Recent Scans - Call Option Opportunities

I have run a couple scans over the last 4 weeks which I did not take time to post on here.  But I wanted to show a couple recent simple scans which identified short term option opportunities which worked beautifully.  Also there is scan I ran last night highlighting a short term call option opportunity.

The last post I made on 11-13-15 noted a bullish short term technical set up and suggested that stocks may see a short term rebound.  I ran a scan of past similar conditions as follows:

  • 3 days in a row closed down
  • today's close was down more than 1%
Trade Stats for Scan

Based on my option pricing model there was a 74% win rate in buying an ATM call option with 1 week until expiration and setting a limit order of 50% to exit the trade.  That limit order ended up being hit the net day on a big rebound in stocks.

I ran another scan on 12-3-15 after a big 2 day sell off.  The scan looked at past times with the following criteria:
  • 2 days in a row closed down more than 1%
  • 63 day EMA was pointed up (to filter for intermediate uptrend rather than during a more oversold market)
Trade Stats for Scan

The past results showed only 15 instances, but ~73% win rate when exiting with a limit order of 69% on an ATM call with 1 week until expiration.  That limit order was hit the next day again on a big 1 day rebound last week.

Currently we have a some what similar set up occurring, where SPY has closed down 3 days in a row.  The intensity has not been as dramatic, and yesterday was only a 0.78% loss.  But I ran a scan with the following conditions:
  • close down 3 days in a row
  • today closes day more than 0.75%
  • Daily MACD is down
  • Weekly MACD is up
  • Daily MACD is above 0
  • High-Low range is less than 2%
It is a more detailed scan but helps to weed out times when the market was more oversold and in a predominant downtrend, often associated with higher volatility conditions than currently would be expected.

Trade Stats for Scan

The data on all these scans only goes back to last 1995, but there are still plenty of instances to get a look at how markets behave in similar instances.  In this case there were 24 instances with ~79% win rate when setting a limit gain of 50% to exit the option (ATM with 1 week until expiration) relative to Wednesday's close in this case.

So the implication is that the market may rebound in the short term.  However I don't like the technical analysis set up as much here.  I would rather see some further oversold or bullish divergence develop on the hourly MACD. 

The chart pattern on the daily SPY chart is a contracting triangle, with price at the lower boundary.  So maybe stocks are set to rebound from here.  And a contracting triangle typically has a significant price break to follow.

It may not be fruitful to over analyze here, but hopefully these stats and the associated short term technical analysis will be helpful for trade decision here or over the coming few days.


Pete


Tuesday, September 29, 2015

Waiting For Some Divergence To Anticipate a Rebound In Stocks

Currently as I review the MACD charts on SPY time frames from 15, 30, 60 minutes, there is no classic bullish divergence on any of those time frames.  So that leads me to suspect that the short term down trend may not be complete.

Today stocks are set to gap up, but I would not be surprised to see price fails to rally in a significant fashion before another push to lower levels is made.  That being said, IF price does push to a slightly lower low with some bullish divergence and price then reverses higher, I would anticipate a brief rally attempt which may meet resistance in the 195-196 region, which would be a pretty sharp move likely.

If SPY gets hammered down today with another major sell off after then open, then it would seem more likely to me that the August lows could be tested this week.  So in short, I would not go long the equity side here yet, until at least a bullish divergence is present and price confirms a little upside with a bullish cross (moving average, MACD, etc) on one of those lower time frames.


Pete

Friday, March 13, 2015

QQQ Hourly MACD Bullish Divergence - Early Week Rally Probable Next Week

Click on Chart of QQQ to Enlarge

This is an hourly chart of QQQ.  Evident on the MACD below the chart is a pronounced bullish divergence between the MACD and price.  Price made a lower low, and the MACD made a higher low and reversed modestly higher today.  This is not enough to trigger a buy signal in my trading algorithm.  But it won't necessarily catch every turn, especially on a short term time frame.

Its seem likely that price could form a short term rebound of at least part of a day, and maybe about 2 days.  Now there is certainly potential even for new highs, but the weekly chart appears solidly bearish at this point, so I don't necessarily count on new high to create the classic multiple time frame bearish divergence which I mentioned in my stock market top video last week.

At this point, my expectation is for a brief rebound from these levels, followed by a move to yet lower lows for this decline.  I won't offer any more expectation than that currently for the short term trading time frame.

On an investment point for stocks, it seems like the only reason stocks have held up is "free money" that has continually been shunted into stocks and stock futures in the last couple years of quantitative easing.  So if long stocks, the February low would be my suggested stop loss point to exit investments.  On could certainly rationalize just remaining long stocks with a stop at that support level or with some % based trailing stop.  That would allow continued appreciation.

Pete


Tuesday, March 10, 2015

SPY MACD and Money Flow Index 3-10-15

money flow index MACD with no divergence
Click on Chart to Enlarge

This hourly chart of the SPY etf shows MACD and money flow index below the chart.  Also there are some vertical lines also which represent the time of the recent rally from low to high in February and that same time amount projected forward from the February high.  If price manages to fall another 4% by March 23, it would move below the February low and would break support but also would retrace the recent rally in less time than the rally took to form which would be a solid logical indication from price action that a pattern completed at the February high.

At this point I don't really have an opinion of whether that is likely, but given the information covered in the stock market top video I made this past weekend, it is on my radar.

The indicators below the price chart show that the money flow index is in the oversold region, but without bullish divergence.  Since it includes volume in the calculation, it tends to diverge and lead prices significantly at important turns.  So this suggests to me that we will see at least a few bars of price action on this time frame with lower lows.

The MACD indicator is relatively oversold and is also not displaying a divergence at the time of this typing.  So, while the possibility is certainly reasonable that prices rally later today and a short term low is formed, a low close today after a gap down may indicate at least a few more days of lower lows in or order to create a more classic bullish divergence in the hourly MACD.

Until otherwise posted here my vote is for generally (and possibly sharply) lower prices in the next several days.


Pete


Saturday, February 7, 2015

USO Oil Chart Analysis

Click on Chart to Enlarge

This chart is an hourly of USO which is showing a MACD indicator in the lower pane.

I have a retracement of the the recent thrust higher on the chart as well as a simple time cycle projecting forward multiples of the time the recent thrust higher took.

A few points of note:
  • The hourly MACD has not yet formed a bearish divergence with price on the rally.  This suggests to me that this rally robust short term move has not topped yet.
  • Since the high earlier in the week, price has traded sideways below the high, suggesting to me that a correction of the initial thrust is occurring.
  • As we move into next week, the time since the recent short term high will be greater than the time of the rally, increasing the possibility that the correction will complete and price will break higher.
I am also showing the b? possibly forming back toward the middle of the recent thrust, creating a more classic abc type look.  That is just an estimate of a typical "flat" type abc move in Elliott wave term, and may be a short term possibility.

Also for those that understand the concepts of overbalancing in price and time, note that the recent thrust off the lows in oil has created a larger move than any rally since the high in June 2014.   So, it appears logically that at least a correction of that decline is underway, if not a major bottom.

I have suggested recently that I think that oil may likely come down to test the lows or make a new low after this rally before bottoming for a longer time.  I still feel from comparisons to past oil bottoms and to the typical weekly MACD divergence present at major lows, that this could occur.  If so, I think next week would likely be the high for this thrust.  But, for now I am just closing tracking this hourly chart so that I can get a better gauge as to when this thrust is running out of steam.

Pete


Tuesday, January 20, 2015

Why I Expect Oil to Rally When Everyone is Bearish

crude oil commitment of traders
Click on Chart to Enlarge

This is a chart of crude oil with Commitment of Traders positions below the price chart.  I wanted to give a little more detail on my perspective on the energy complex.

Of note on the large speculators positions, they have gotten progressively more short until early December which is their normal pattern.  They are the money that drives speculative trends.  Interestingly however, as price began to accelerate down ever faster at the beginning of December, the large specs have not increased the short position.  At this point there is a bullish divergence in the positions.  So crude oil has fallen 33% without the large specs increasing their short position.  This type of divergence is pretty classic as a trend ending pattern in underlying positions.

For basic understanding, first realize that the money that drives trends comes from somewhere.  And when the biggest money that there is, which drives the price trends, no longer follows the trend, the implication is that they do not have any more fund capacity collectively to participate in or push that trend.

So we have certainly ample evidence of that with a multi week massive decline but no further shorting by the large specs.  Additionally, there is now in the last few weeks at least a modest return to the normal commercial/smart money pattern of buying as prices decline.  So that indicates to me that the very directional commercial capitulation stage of this decline is likely waning.

Additionally, the daily MACD is demonstrating bullish divergence, and the money flow index is demonstrating pretty classic reversal divergence.  The money flow index basically looks at price and volume and typically demonstrates a substantial lead time with prices.

Taken together, it appears to me that energy prices (including natural gas, heating oil, gasoline) are likely to stage a rally very soon.  Whether or not it will be a bear market rally I don't know.  I would lean towards believing that because of no weekly time frame MACD divergence currently at these lows.  I think it will more likely turn into a volatile basing period or a rally followed by a failed breakdown to new lows before prices may bottom longer term.  But that is looking out kind of far for my purposes.  Really I am just interested in catching the next swing up, which I expect to be quite swift given the major oversold condition of this market.

XLE bullish divergence
Click on Chart to Enlarge

For those more interested in equities, this is XLE which is a major ETF covering oil and energy related stocks.  Notice how it has not maintained the aggressive decline that oil has.  And it also is displaying a drawn out bullish divergence on the MACD with a more classic chart pattern bottom with a failed breakout below the December 16th low, followed by an immediate reversal higher.  This indicates a stop running move in the market and that the buying interest was picking up right at that low as other (dumb money) was selling out or shorting in the break.  This makes the dumb money about as wrong as possible and the smart money about as right as possible.

For trading purposes the XLE etf may be a better purchase or near term speculation than crude oil itself.  That remains to be seen, but just understand there are several ways to participate in this probable reversal.

Wednesday, December 17, 2014

SPY Oversold Going into FOMC Announcement 12-17-14

Click on Chart to Enlarge

As of yesterday's price action, SPY was oversold and showing bullish divergence on the hourly price chart.  Today is the FOMC announcement and so there is the possibility of a news-driven sharp move here.  Given the technical set-up, it seems likely for a rebound attempt.  A major downer would be unexpected here, but could be of longer term significance.

There has not been a bottom reversal signal in my SPY trading system currently, and there has been no bullish divergence to develop in the underlying real money sentiment analysis.  So in the past that has typically meant that we see at least a slightly lower low before a reversal occurs.  If that occurs followed by a reversal bar, we likely will see a signal occur and it so, I will note it with some detail on the significance and how to trade it, if at all.

Additionally, the VIX/VXV ratio has closed above 1.00 for 2 out of the last 3 days before today, and as I have noted repeatedly on this blog in the past, that often occurs just before an important low occurs.  So really, it means that you take any objective long trading signals generated here.  The signals dependent upon your plan and trading method.

Further understand that we are entering into a positive seasonality in the end of year time frame, which would just again be another confirmation that long signals should be acted on.  And a stop is always used in case of a major surprise or trend shift.

Pete

Wednesday, September 3, 2014

Bearish Engulfing Pattern in QQQ Could Mark a Top

QQQ Bearish Engulfing Pattern Could Be a Market Top
Click on Chart to Enlarge

Today both the QQQ and SPY formed bearish engulfing candlestick patterns.  These are top reversal patterns, and should be considered significant if there is a technical overbought condition, a failed breakout on a chart, or a bearish divergence.

Currently, there is a triple time frame (weekly, daily, hourly, and even 15 min) bearish divergence on the MACD of the QQQ chart with other massive divergences in breadth, volatility, and put/call ratios.

So my current suggestion here is that you completely exit all index long positions on the US stock indexes.  This has the technical and sentiment back drop for a potential major high, and we are entering the seasonally weak period of Sept/Oct, which should just be an additional factor for the trader to understand here in terms of market dynamics.

Short positions could be established on a break of today's low, with an initial profit target of 1:1 with a stop above today's high.  So since this has the possibility for a big move down, you only exit 1/3 or 1/2 the position at the initial profit target.  And another option is to just hold the whole position with a stop adjustment mechanism and allow the market to go however far it will until we get a legitimate bottom reversal signal.  The pros to the first strategy is a higher win or breakeven rate, but a probably lower expectation given the quality of the set-up.  The second scenario likely has a lower win rate but a higher overall profit expectation in my opinion.


Sunday, August 17, 2014

Multiple Time Frame MACD Bearish Divergence on QQQ Suggesting a Possible Bull Market Top

Multiple Time Frame MACD Bearish Divergence on QQQ Suggesting a Possible Bull Market Top

I have published a new technical analysis video covering the Nasdaq, VXN, banking stocks, and housing stocks in depth.  The trend channel and MACD technical analysis as well as broad scale index and sector non-confirmations suggest to me that a major top is indeed in process here in stocks.  That is my opinion anyway from an analysis standpoint.  As always, translating analysis into objective trading is another level, so simply use this info within an objective trading context.

Futures this evening are up, and it will be interesting to see this week whether there is a weekly top reversal candlestick in QQQ.  A gap up tomorrow/Monday followed by a significantly lower close on the week, would fit with the typical topping price patterns seen in markets.  If prices on QQQ this week close below last week's open @ 95.27 after a gap up tomorrow, that would be a weekly bearish engulfing pattern, and that would be a significant price bar given the technical analysis in my opinion.

97.94-98.35 would be the typical topping price range for QQQ given the hourly chart technical analysis in my opinion.  I personally have an order to purchase deep OTM puts on the SPY etf to take advantage of a possible top and sharp decline into the seasonally weak period of Sept-Oct in stocks.

Saturday, March 22, 2014

MACD Multiple Time Frame Bearish Divergence on SPY


MACD Multiple Time Frame Divergence on SPY

This stock market video covers the SPY ETF and explains the current multiple time frame divergence in the MACD indicator.  There are both weekly and daily time frame bearish divergence patterns in SPY which indicate the potential for a significant high occurring at this level.

Additionally there is a minor failed breakout of the March 7th high, and a potential major failed breakout of the January 2014 high if prices continue lower below the 185 level.

Friday displayed a reversal day in SPY with the S&P 500 moving to slight higher highs, but reversing sharply and closing near the lows in a wide range day.

On the balance the technical analysis suggests that stocks are likely in a position to decline from this level, and traders should be in cash or sizing up shorting opportunities.


I wish you all the best in your trading.  If there is anything else I can do to help you develop as a trader, drop me a comment to let me know what it is or check out my trading courses.

Pete

Monday, November 25, 2013

How to Move Stop Losses to Stay With the Major Trend - Stock Market Update 11-25-13

 
Stock Market Update 11-25-13
How to Move Stop Losses to Stay With the Major Trend

 This stock market update video covers multiple time frame analysis of the S&P 500 tacking ETF, SPY.  The MACD indicator is analyzed at the 15 min, 1 hr, 2 hr, 4 hr, 1 day, 1 week, and 1 month time frame.  Bearish divergence is present on the MACD on the lower time frames, warning that the stock market could potentially be ending an uptrend of varying degrees.

However, price is the final say, and divergence patterns can fail to lead to meaningful reversals.  Given that we are currently in the seasonally strong time for stocks and the market is at all time highs with no overhead resistance, this is a distinct possibility.

I also show you a simple, yet very effective way to trail stops using the MACD indicator  relative to price action.  This method will allow you to stay in most large trends and failed divergence patterns until the trend is done or nearly done.