Showing posts with label money flow index. Show all posts

Wednesday, March 30, 2016

Daily Time Bearish Divergence in Money Flow Index and MACD - SPY 3-30-16

SPY and Money Flow Index
SPY Overbought Money Flow Index with Bearish Divergence
This daily chart of SPY shows the 50 and 200 day moving averages which are in a longer term downtrend currently (50 day below 200 day) as well as the 14 period money flow index with a 14 period moving average of the MFI.

What is apparent is an overbought MFI with both the raw MFI and the 14 period average in the extreme region.  And now, after a small pullback and MFI (brown line) dipping below its average (blue line), price has moved to a new high, but the MFI is at a lower high creating a classic bearish divergence pattern on this indicator.  This type of pattern has occurred very near to the final price highs before significant pull backs in SPY over the last couple years.

In an up trending market, I'm sure that the end results could be uneventful.  However, given the moving average downtrend configuration, I believe that this signal should be respected as an exit signal for longs.

I don't have a strong opinion on whether the bull market is complete, and a major decline will take place, though given the Commitment of Traders data on the rally up since February, it seems reasonable that this whole rally has been a short covering move with no big money new interest taking place on the long side.

I will look at speculative opportunities on the downside possibility to come from these levels.


Pete

Monday, October 12, 2015

SPY Looks Ready to Pullback This Week - 10-12-15

Click on Chart to Enlarge

As a follow up to last post here is the updated hourly chart of SPY showing the lower peaks in the money flow index and a cross of the MFI below its moving average.  This is a picture perfect indicator divergence to signal a top.  Now it seems that stocks are still not ready just yet to decline, so it may take at least another to poke to higher highs before selling comes in.

At this point I have run several scan over the last few sessions, and based on similar moving average and technical indicator set-ups in the past, there is a very negative expectation for the next couple months.  Buying a 2 month until expiration ATM put on SPY here has been a profitable play in similar set-ups over the last 20 years.

So again I like a short entry here with a stop 3-4% above the market based on some previous stats.

Check last post as a further indication of moving average signal to look for confirmation of a new downtrend possible.

Thursday, October 8, 2015

Dual Time Frame Overbought Signal in SPY 10-8-15

Click on Chart to Enlarge

The technical position of SPY is currently showing the classic type of formation in the last stage of an advance - in this case at least on the hourly chart.  The money flow index peaked a couple days ago, and now it has declined and is ready to poke back above its average.  The next cross of the money flow index below its average after a bearish divergence in this position is typically coincident with a top.

Also the daily 14,3,3 stochastics is now basically overbought with %K>80 and %D at about 76.  So there is a clear dual time frame of daily overbought, and hourly time frame bearish divergence in the midst of downtrending long term moving averages (252, 200, 63, 50 day MAs).

I would anticipate a multi day top would be likely be in place by tomorrow.  The gap up at 195 which is unfilled, would be the first obvious target for next week.  

I like the odds and historical expectation stats of entering short/puts here without waiting for confirmation of reversal.  A reversal candlestick today or tomorrow, like a bearish engulfing pattern, occurring right at the resistance level in the 200 region which has been established since Aug 24th, would be a nice daily confirmation signal that a multi day decline may begin.  

Also a 30 minute 8,21 EMA cross down would  be a reasonable lagging indicator to initiate a short with a stop above the intervening high.


Pete


Monday, July 20, 2015

Low Panic Levels Suggest Negative Skew Over Next 2 Months

Click on Charts to Enlarge

As of today's close, my complacency indicator shows a reading below 7.0.  The images above show all times in this bull market with readings below 7.0.  Of note is a consistent greater max loss than max gain on all time frames out to 5 months.  The greatest skew to the downside is at 2 months where it is about 1.6:1 in favor of downside.

Looking at the options gains for calls and puts for ATM options with 2 months until expiration, there are about 55 days which meet the criteria and the average max put option gain is about 150%. 

About 8 out of 10 of the instances showed max put gains of greater than 50%.

About 6 out of 10 of the instances showed max put gains greater than 100%.

So those stats suggest a couple obvious trading or hedging strategies by simply buying the put now, and setting the limit exit order.  Of course fine tuning could be attempted as action unfolds.

Now the 14 period Money Flow Index is also currently greater than 70.  When adding that criteria to the filtering process the 2 month max loss and gain show greater than 2.0:1 skew in favor of max loss.  And half the instances showed put gains of greater than 150%.

So I think an ideal situation here would be for some further upside leading to a divergence in the MFI and then to speculate on the puts. 

But for now, a 2 month hedge with ATM puts and a 50% limit order to exit the position seem like a solid odds play to protect for some potential downside into September.


Let me know if there are further details desired in regards to this data.


Pete

Wednesday, May 20, 2015

NTAP July 35 Call Option - Earnings Today After the Close

Click on Chart to Enlarge

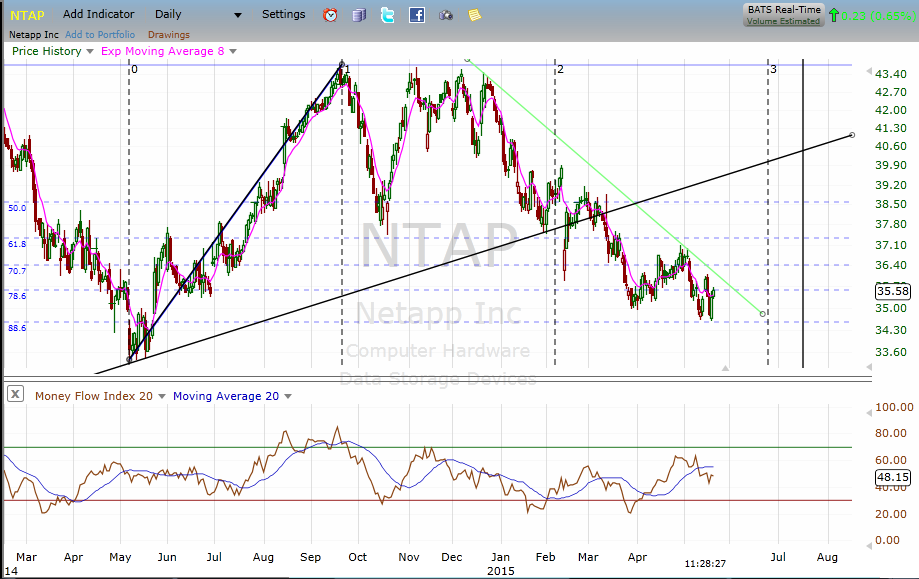
I bought a NTAP July 35 call option this morning.  Earnings is reported today after the market closes, so this is a known high risk trade.  The rationale is very clear though.  If you check weekly and daily stochastics you can see that both have bullish divergences at yesterdays low.  And yesterday formed a bullish piercing pattern candlestick reversal.  There was a small gap up today, and the option was bought for 1.60, so there is only a modest rise needed for price to reach breakeven.  And a rise to the October 2014 low should move the option up 100%.  On a successful bottoming pattern in a stock, an earnings announcement in this position will often lead to a gap up which breaks the down trend line.  So I would expect a gap up to above the 36.25 level if the bullish formation continues.


Click on Chart to Enlarge

This chart is also NTAP but shows a 20 period money flow index.  The interesting thing here is the massive bullish divergence in money flow index.  It is at a multi month high as price is hitting lower lows.  If you look back at the low last May previous to earnings, there was a nearly identical bullish divergence pattern in advance of the earnings announcement and breakout of the downtrend.

Understand here that if things don't go as expected, the option will lose almost all its value, possibly rapidly.  So consider this for educational purposes.

Thursday, April 9, 2015

QQQ Short Trade Set Up - Price Logic and Bearish Divergence

Click on Chart to Enlarge

The chart shown here is an hourly of QQQ which is the Nasdaq 100 ETF.  For those who have followed this blog for a while and understand some concepts related to price logic and divergences, this should be an interesting pattern to watch unfold.  There is an obvious bearish set up here to short or inverse the Nasdaq if an appropriate signal occurs beneath point 0.

So notice the the move from -1 to 0 was retraced in less time than it took to form.  That indicates a probable short term (at least) pattern completion and the beginning of a new downward pattern in the market of some degree.  Now it is clear that the price action upwards from point X has occurred more slowly and with clear corrective/overlapping swings, suggesting that the move up from point X is probably a correction against a still developing larger downward price trend.

Since the smallest "pattern" that can develop is a 3 wave move, and point X has not been breached, it would seem likely that the next move down is likely to move below point X.  The other possibility from a pattern perspective is that a sideways/triangular pattern is forming within the bounds of points 0 and X.  In that case price would not be expected to break point X.

Now the study below the chart is a money flow index which is basically an RSI of both price and volume combined.  So it tends to be a leading indicator more so that price only based studies like MACD or RSI, etc.  Currently the MFI is displaying a bearish divergence at today's new high for the recent rally from point X.  Now the MFI is not at an extreme level, so it is arguably to significant.  But the other reasonable interpretation is that the current up move is very weak and this is an imminent sign of topping and another directional downward thrust in price.

Analysis is easy.

Consistently making objective buys, stop adjustments, and sells is much more challenging.

So for the trader here this pattern creates a nice set up to short the market or make a stop adjustment on an open short position to above point C if a sell signal is generated below point 0.  Another speculative play here would be to buy put options on the indexes here.  An ATM put option with April 24 expiration would have a very reasonable 100%+ profit potential if prices decline to point X before expiration.

If you have questions or ideas on managing open trades here or entering new positions, comment and we can proceed with further analysis and planning.

Pete

Tuesday, March 10, 2015

SPY MACD and Money Flow Index 3-10-15

money flow index MACD with no divergence
Click on Chart to Enlarge

This hourly chart of the SPY etf shows MACD and money flow index below the chart.  Also there are some vertical lines also which represent the time of the recent rally from low to high in February and that same time amount projected forward from the February high.  If price manages to fall another 4% by March 23, it would move below the February low and would break support but also would retrace the recent rally in less time than the rally took to form which would be a solid logical indication from price action that a pattern completed at the February high.

At this point I don't really have an opinion of whether that is likely, but given the information covered in the stock market top video I made this past weekend, it is on my radar.

The indicators below the price chart show that the money flow index is in the oversold region, but without bullish divergence.  Since it includes volume in the calculation, it tends to diverge and lead prices significantly at important turns.  So this suggests to me that we will see at least a few bars of price action on this time frame with lower lows.

The MACD indicator is relatively oversold and is also not displaying a divergence at the time of this typing.  So, while the possibility is certainly reasonable that prices rally later today and a short term low is formed, a low close today after a gap down may indicate at least a few more days of lower lows in or order to create a more classic bullish divergence in the hourly MACD.

Until otherwise posted here my vote is for generally (and possibly sharply) lower prices in the next several days.


Pete


Thursday, February 5, 2015

DDD Technical Analysis and Short Interest Analysis

DDD with heavy short interest
Click on Chart to Enlarge

This chart is a daily chart of DDD.  I bought a May 29 strike call on it yesterday.

The technical position of the stock is compelling for a rally here in my opinion.  Price has under cut a low from March 2013 (not visible on this chart) and reversed higher here.  Stochastics is showing a weekly and daily bullish divergence on the low Tuesday in conjunction with a very high volume gap down and under cut of the January lows only to reverse and close in the upper end of the range and above the January lows.  This has the appearance of a failed break of support which often provides a high quality long entry.

There is money flow index bullish divergence on the recent leg down, indicating that the downtrend is running out of steam.

The stock is heavily shorted with 33% of the float short as of 1/15/15.  The short interest ratio is 12.5 which is rather high and indicates plenty of short covering potential on a rally.  While I don't have detailed data on the underlying short squeeze trigger price, I am estimating that a rise to the $35-38 level will likely cause some short covering based on the short interest increase from October to December.

Another factor here is that earnings comes out 2/26/15 before the market opens.  Given the oversold technical position of the stock with bullish divergence, I would give better than even odds to a bullish response during this earnings period.

Pete


Tuesday, February 3, 2015

NUE Call Option - Steel Should Be Rallying Too

Click on Chart to Enlarge

This chart is a daily of NUE which is in the steel and iron industry.  Along with commodities, steel stocks have taken a major beating in recent months.  And it is a place to bottom fish for big reward opportunities currently in my opinion.

Notice that as price has moved lower the last couple weeks, the money flow index has made progressively higher peaks, indicating that the trend may be set to reverse.  Now we are seeing a pop higher from a fibonacci support zone and a major, multi layered bullish divergence.

I believe this stock has good potential for continuation higher.

I have an order to buy an April 44 call option for 2.35 or less.  It would take a mild 1% or so pullback for the order to fill, but given the very short term overbought nature of these materials stocks right now, I think it has a good chance to make that pullback, and that will also create a more favorable reward to risk scenario for the option.

Pete


Saturday, January 3, 2015

Time to Buy Oil or Speculate on Call Options

Click on Chart to Enlarge

The chart above is USO which is an ETF that tracks crude oil prices.  Obviously anybody at this point is aware that oil has fallen substantially.  That fact in and of itself is reason to consider buying oil or putting it on a speculative watchlist.

And when I say that "anybody" is aware of crude's decline at this point, I can say from experience in recent years of market cycles, that there are certain social "tells" that are pretty raw psychological indication that a trend is near its end.  Dependent upon your social circles, and how much you much interact with "the public" etc, you may be able to get significant information from just making note of ANY comment on a particular market by "the public".  Recently, within the last 3 weeks, I have heard people comment how low gas prices are - people that I have never heard mention prices of anything in any other conversation.  Market prices are not even on their radar. 

So if you think about the herd psychology and obviousness of the trend which must be occurring for their brain to now verbally note this in a group of others, where the potential for criticism or confrontation of significance exists, it seems to me that this is a very REAL and astute indication of the end of a trend, when the "dumb money" is compelled to note it.

So this is the current backdrop in which we find oil/energy prices.

Now we currently have other technical indications that the trend is ending. 

There is triple time frame stochastics bullish divergence (weekly, daily, hourly) at the current low.

There is daily time frame MACD divergence at the current low.

The recent consolidation on the last couple weeks formed a triangle, which typically is a pentultimate price pattern, meaning it occurs just prior to the last move of a trend.

There is now substantial Money Flow Index bullish divergence (which takes volume into consideration) and the trend in money flow appears to be turning up.

So moving to the chart above, there has been a moving average crossover of the money flow index after an extreme oversold reading with bullish divergence.

AT A BARE MINIMUM if you are short oil or energy at this point, I suggest you cover the position.

If you are an options speculator, I would suggest $19 or $20 strike calls with a few months until expiration.  A very simple, and in my estimation a well in excess of 50% probability of winning trade, would be to buy an April 20 strike call on USO and to put in a limit order to sell it at 100% gain.  Let it expire worthless if the order is not filled, or exit at expiration with the value in the option if the 100% gain is not hit in the meantime.

Another similar play would be to buy the October 20 strike call and to hold for a 100% gain with the same exit contingencies just noted in the previous idea.

If you make a trade on this and want follow up analysis or help with fine tuning the exit, then comment here or email reply to me and I will follow up on this with you.

Pete