Showing posts with label bearish divergence. Show all posts

Tuesday, March 13, 2018

Bearish Reversal Pattern With Divergences 3-13-18 Stock Market Update

Click on Chart to Enlarge

The chart above is the Nasdaq composite daily.  It has made a new high above the January highs, and today created a wider range bearish engulfing pattern which is a top reversal pattern potentially.

I view this as potentially meaningful for a number of reasons some already discussed in recent posts, but I will create a short list


  • Significant non-confirmation of other indexes to make new highs
  • VXN touched lower bollinger band yesterday
  • Cycle time analysis turning lower for next couple weeks
  • Dual time frame MACD divergence in Nasdaq (Daily, Weekly)
  • Price touching the top channel line of the high for the bull market 
  • Breadth and sentiment major divergences
I view the risk to be a good bit higher than reward potential for the next couple weeks.

I have an eye on inverse positions or put options here currently.


Pete

Thursday, June 8, 2017

Expanding Triangle or Diagonal Top Appearing on SPY - Probable Move Down to 232-235 in Coming Few Weeks

Click on Chart to Enlarge

Currently stocks have been moving higher but with notable weekly time frame bearish divergence in MACD on the SPY etf as well as bearish divergence in the breadth.  So fewer stocks are hitting new highs or advancing relative to previous price peaks.

This is classic type technical signals of a topping of a leg up in prices.

I had noted some recent scans which suggested a likely higher downside risk to upside potential.  However, we have seen mostly upside since then.  Though with the low volatility it has not been a big advance in percentage terms.

The 60 min chart of SPY is now again at a point of notable bearish divergence, and so if a multi week top is to form, it could do so here over the next day or so.

On the chart above I have put a pattern labeling scheme.  I put this here because the pattern in play appears to fit the back tests of price and sentiment studies suggesting downside risk over the coming weeks or couple months.  And clear price patterns can give some refined targets or expectations that may help a trader manage the trade more effectively than a purely mechanical or statistical method.

If this move is a "terminal" move then the implication is for a rapid move back to the starting point of the pattern around 232 on SPY.

If this move is a "B" move then it may be a less explosive downwards move back to the 232-235 area as support, but not necessarily back to the 232 level.

From my perspective of observing market price action relevant to price patterns and key support areas, if prices do correct and move below the 232 level, I think that would likely be a temporary climax point where stops would be run under support, and then prices would begin a rebound of some extent.

Pete

Friday, May 26, 2017

Further Signs of Intermediate Term Topping and Probable Downside to Come For Stocks 5-25-17

Click on Table to Enlarge

Last week I showed stats from past instances where there was a 1.5% decline in SPY the day after a 52 week high.  And the average displayed a notable bearish skew for the next couple months, though about half of the instances rebounded back to near the highs after that initial big sell off day.

This rebound scenario is what we have seen in the current market.

I have run a couple scans over the last few days, and it still appears that similar past markets have had a notable bearish skew looking forward a few months,

The chart above shows the forward MAX gains and losses from a scan including bearish divergences in VIX, total put/call ratio, volume, MACD and stochastics on daily and weekly time frames.  So basically just an across the board price and real money sentiment bearish divergence.  And the bearish skew is notable for the first couple months.

Another scan criteria looked at unique instances when there was both daily and weekly bearish divergence in the MACD when the VIX closed below 11.  The results were similarly bearish.

There are good trading opportunities here based upon my method and the data at this point.
Based upon past SPY data, shorting here and setting a limit order to cover at 5.75% gain while also setting a 5.75% stop loss would provide a roughly 2.25% expected value over the next month.  The trade would be exited after 21 trading days if neither stop nor limit was filled.

Any where in the 4% to 6% paired limit and stop orders basis SPY would be very reasonable plays.  And 4% the ratio of the risk to the expected value is the lowest, and after that there may be higher expected values with wider orders, but the risk rises more than the expected value increase does.

I am electing to purchase SPXU here and use 12% limit and stop orders.  The simplest way to do this is with an OCO, one cancels the other, order where one order is a sell stop and the other order is a sell limit.  Then set a time reminder to exit on June 26th if neither order is filled already.

For the options side of things, a 130% limit gain order from the closing price yesterday on a 241 strike June expiration put option, would provide a very positive expected value with about a 66% win rate based on past similar instances and the calculation of my algorithm.  For this trade, there is no stop on the option.  It could expire worthless, but a limit gain GTC is set immediately after entry.

Pete

Monday, January 9, 2017

Multiple Time Frame MACD Divergence In SP500 - Correction Or Bull Market Top Ahead?


Click on Charts to Enlarge

The charts here are the SP500 cash for the top three (monthly, weekly, daily) and SPY for the bottom chart, which is 60min candlesticks.

The monthly, weekly, and daily time frames are all currently displaying bearish divergence at the recent high on Friday.  Given the confluence and time scale of these divergences, I believe that price may be near a crest.  While tops can be sloppy and drawn out, we have already been seeing that for about 2 years.  

Rather than prognosticate on causes and projections and patterns, what we objectively are seeing is a divergence which truly indicates a "slowing" of the trend.  And the divergences so often occur preceding major changes in direction.  So I imagine that like a ball thrown up into the air will gradually slow before it reaches its peak and then begins to travel back down, the rising market will experience progressive slowing down, until it reaches a peak and turns down.  The smaller time frame divergences, I imagine to help identify the finer timing or reaching of the zenith in price.

So much for theories.  But what has happened in the past under some similar circumstances?

I ran a scan on SPY going back to late 1995 where there was a weekly, and daily time frame MACD bearish divergence concurrent with, or within a month after a put/call ratio sell signal like happened a couple weeks ago in the current market.  I also went through and excludes most days after the first signal day if there were a cluster within a 2 week period.

There result is that there was a negative skew in forward return looking out for a couple months.  It was not real lopsided, but in anycase it does support the idea that stocks may be near a relative top.  From a probabilistic standpoint is the only way we can meaningfully approach it for trading.

The skew is not real strong but is most prominent looking ahead about 3 days and at 1 month.  At 1 month after the past signals, the average closing return has been a mild negative at -0.25%.  And the MAX loss has been about 1.3 times the size of the MAX gain.  The numbers here are not strong enough for me to suggest an inverse trade based on those stats alone.  

So there is not a lot actionable here from the trading front.  But for those who want a larger market context for incorporation into trade selection, hopefully this helps.


Pete


Tuesday, April 19, 2016

Intermediate Term High Likely Completing In SPY 4-19-16

I ran a pretty simple scan today on the history of SPY (going back to fall 1995).  The criteria were as follows:

  • VIX high is less than 15
  • 5/63 day total put/call ratio less than 0.85
  • Daily MACD is in bearish divergence position
The forward returns showed a nearly 2.4 times greater MAX loss versus MAX gain over the coming month.  And buying a 1 month until expiration at the money put option on SPY had a 2 out of 3 chance of at least doubling in price prior to expiration.  So that is a very profitable speculative opportunity to buy the put here and simply set a limit order to exit at 100%.  Let it expire worthless if it loses.  There is no stop.

Also there is a dual time frame (hourly and daily) MACD divergence on today's highs in SPY.  These types of set-ups have been highlighted many times on this blog and often nearly pinpoint a significant turning point for multiday or multi week changes of direction.

So the point here is that SPY is at a lower high than the last intermediate term high in November, and SPY is displaying the type of set up which indicates a completed rally.  So the easy money has been made.  The expected returns for the next several weeks are likely to be flat or negative based on what I have looked at.  

Let me know if there are any questions or specific scenarios you want further info on here.


Pete

Wednesday, March 30, 2016

Daily Time Bearish Divergence in Money Flow Index and MACD - SPY 3-30-16

SPY and Money Flow Index
SPY Overbought Money Flow Index with Bearish Divergence
This daily chart of SPY shows the 50 and 200 day moving averages which are in a longer term downtrend currently (50 day below 200 day) as well as the 14 period money flow index with a 14 period moving average of the MFI.

What is apparent is an overbought MFI with both the raw MFI and the 14 period average in the extreme region.  And now, after a small pullback and MFI (brown line) dipping below its average (blue line), price has moved to a new high, but the MFI is at a lower high creating a classic bearish divergence pattern on this indicator.  This type of pattern has occurred very near to the final price highs before significant pull backs in SPY over the last couple years.

In an up trending market, I'm sure that the end results could be uneventful.  However, given the moving average downtrend configuration, I believe that this signal should be respected as an exit signal for longs.

I don't have a strong opinion on whether the bull market is complete, and a major decline will take place, though given the Commitment of Traders data on the rally up since February, it seems reasonable that this whole rally has been a short covering move with no big money new interest taking place on the long side.

I will look at speculative opportunities on the downside possibility to come from these levels.


Pete

Friday, March 11, 2016

McClellan Oscillator, NYSE TICK, and VIX All Showing Bearish Divergence With SPY

On today's rally in SPY up to touch and close above the 200 day moving average, there are multiple short term divergences occurring.  This indicates that stocks could pull back from this level immediately.  However, in a previous post I had highlighted unfilled gap downs on SPY, with the 204 level being a likely target for this rally, even if the market were to roll over into a bear market.
So currently, that gap is still unfilled and only about 1% above current levels.
McClellan Oscillator Overbought with Bearish Divergence
 McClellan Oscillator is now showing a sharp bearish divergence today after a recent overbought reading.  If stocks are in a counter trend rally to a long term down trend, I would expect the top to occur very quickly.  Counter trend moves tend to create a spiky short divergence pattern in the McClellan Oscillator.  If stocks are going to move to new bull market highs or have a sustained rally, a more sloppy drawn out divergence pattern is likely to emerge.

NYSE Tick Showing Bearish Divergence on Hourly Time Frame
 This is an hourly chart of the NYSE TICK index which is a short term measure of breadth.  We currently see a sharp bearish divergence relative to new price highs in SPY today for the rally up from February lows.  This again implies that the trends ability to sustain is in question.  What is occurring is that fewer stocks are moving higher than were earlier in the move.  That is classic action as a move tops.
VIX Showing Non-Confirmation Relative to SPY
Since the VIX is correlated inversely with stocks, we would expect the VIX to make a lower low when stocks make a higher high.  In this case, the VIX did not quite make a lower low.  The hourly VIX chart shown here shows that the VIX is hovering above the longer tern bollinger band on this time frame.  If the VIX pokes down to this level, that would be further sign of a statistical extreme and probable mean reversion ahead.  So let's keep an eye on this.  But even as it stands, this is a bearish type of signal.

Certainly as price has moved up to the 200 day moving average and daily stochastics shows a bearish divergence, money flow index is overbought, and the short term measures here are displaying bearish divergence, I think that for trading purposes, anyone who is long would be wise to exit.  That way you are out of the market and ready for the next move.  Expect that it will be a few days or more before stocks make a possible top.

Keep in mind the stats I recently showed regarding a SPY inverse etf trade, or a SPY put option trade.   Those looked at price movements likely over the next 1 month.  That study is still young, and implies that with the pop higher today, the reward to risk profile may be even better.


Pete

Friday, March 4, 2016

This Rally Still Appears to Have Some Room to Go - Next SPY Resistance is $204ish

McClellan Oscillator Overbought But Without Bearish Divergence
NYSE McClellan Oscillator
Click on Chart to Enlarge

The chart of the daily McClellan oscillator shows breadth hitting new peaks on recent highs.  This is strongly suggestive that the rally will make further higher highs before reversing.

So it doesn't necessarily mean that it will have a lot higher to rise, but in my observation of markets over the last decade, there almost always is a bearish divergence development in this indicator before a meaningful top occurs, even in a counter trend rally.

So, at this point I would expect the next unfilled gap down at about 204 on SPY to be tested before this rally would be likely to stall out (if  it even does stall out and lead to a major correction).

I will run some scans over the next week to help quantify the risk reward of potentially shorting or speculating on resumption of a larger downside in the upcoming days.  But I would not jump the gun here as far as speculating on the downside.  Let it play out.  Let some divergences develop and let the sentiment and breadth show in definite terms that a typical topping type action is occurring.

I will update as it unfolds.


Pete

Wednesday, October 28, 2015

Complacency In the Markets As the FOMC Meeting Occurs

Click on Chart to Enlarge

There are a number of shorter term notable bearish divergences occurring over the last couple weeks as stocks have continued to advance.  Also, there are some intermediate term sentiment extremes showing up in the put/call option data.

Today the FOMC released minutes and as occurred at the Sept 17th meeting, the VIX is at a relative low, contacting the lower longer term bollinger band on the chart above.  This indicates complacency in the options market relative to the recent range.  This type of signal occurs frequently near inflection points, in this case possibly with a short to intermediate term top in stocks.

There are several other indications of loss of momentum in stocks here.  I will run some scans over the next couple days to look at possible profitable opportunities in the options and stocks.


Pete

Thursday, October 8, 2015

Dual Time Frame Overbought Signal in SPY 10-8-15

Click on Chart to Enlarge

The technical position of SPY is currently showing the classic type of formation in the last stage of an advance - in this case at least on the hourly chart.  The money flow index peaked a couple days ago, and now it has declined and is ready to poke back above its average.  The next cross of the money flow index below its average after a bearish divergence in this position is typically coincident with a top.

Also the daily 14,3,3 stochastics is now basically overbought with %K>80 and %D at about 76.  So there is a clear dual time frame of daily overbought, and hourly time frame bearish divergence in the midst of downtrending long term moving averages (252, 200, 63, 50 day MAs).

I would anticipate a multi day top would be likely be in place by tomorrow.  The gap up at 195 which is unfilled, would be the first obvious target for next week.  

I like the odds and historical expectation stats of entering short/puts here without waiting for confirmation of reversal.  A reversal candlestick today or tomorrow, like a bearish engulfing pattern, occurring right at the resistance level in the 200 region which has been established since Aug 24th, would be a nice daily confirmation signal that a multi day decline may begin.  

Also a 30 minute 8,21 EMA cross down would  be a reasonable lagging indicator to initiate a short with a stop above the intervening high.


Pete


Thursday, May 21, 2015

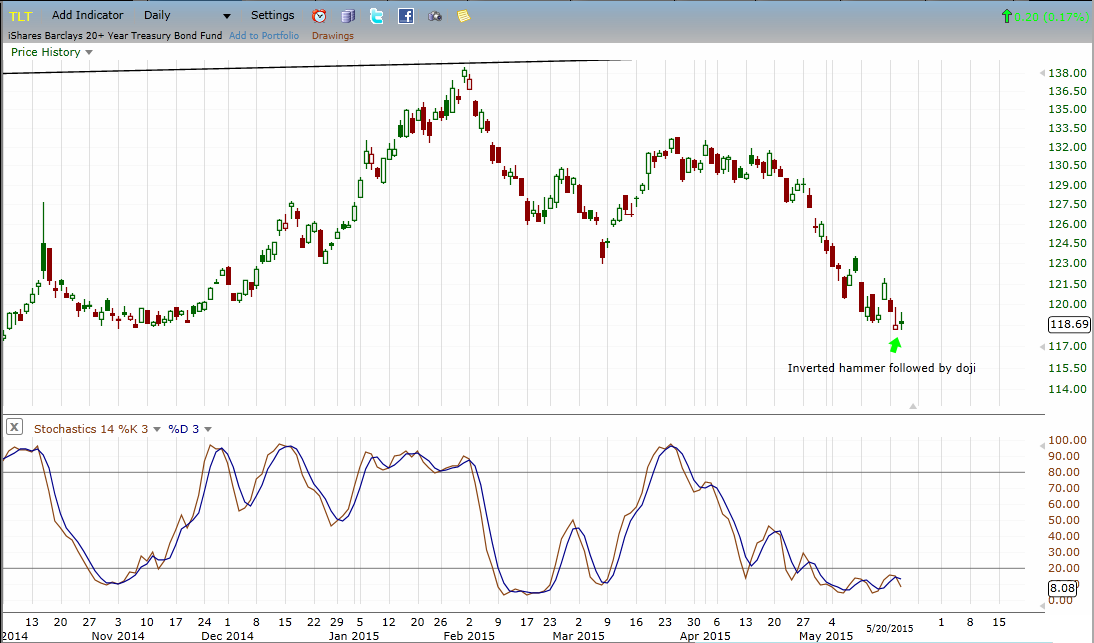
TLT Dual Time Frame Long Set Up and Nasdaq Doji At Resistance Implicating a Possible Top

Click on Chart to Enlarge

This chart is TLT which is the US long term bond ETF.  For the first time in the current decline since the January high, there is a dual time frame long set-up.  The chart shown here is a daily chart which shows stochastics bullish divergence in the oversold region.  If you click to a weekly chart, the weekly stochastics is oversold also.

Now the last 2 days we have seen 2 successive potential bullish reversal candlesticks.  The first is an inverted hammer, the second is a doji.  A gap up open above the high of today's doji would be a solid signal for bullish reversal.  Now I don't really think that bonds are likely to remain in a long term bull market, but for the short term it seems like the set-up is ripe for at least a multi day rally.

And part of the significance here is that bonds are once again trading largely inversely to stocks since the high in bonds this winter.  This would suggest the potential for a bond rally and stock decline in coming days or weeks.

Click on Chart to Enlarge

The total put/call ratio has given a combination of signals which is certainly more bearish than bullish.  The recent 5 day average close below the 126 day 1 period deviation band last week.  The last few instances of that were right near a point of pullback in the markets - short lived yes, but providing opportunity for recognition to take profits near the top and also to buy short term put options with 100%+ profit potential over the next few weeks.

The hourly chart of the VIX is showing non confirmation with the stock indexes the last 2 days creating another short term warning of pullback.  The hourly TICK averages show the same thing also indicating topping here.

There is a triple time frame weekly, daily, hourly MACD bearish divergence on SPY today which I have pointed out instances of before.  In any case the current high could be the end of a rising wedge or terminal pattern which would implicate a strong downtrend to come.  The alternate is probably that the current consolidation is still a basing from last fall's run up.  So a modest decline and break to new highs, would be a potentially significant bullish event.  

Click on Chart to Enlarge

This chart is the Nasdaq composite.  Today formed a doji candlestick on higher volume - which is often more significant than lower volume as it shows the struggle at hand with increasing activity but no progress in price.  The doji is forming in the region of the recent wide range bearish engulfing pattern which occurred just under the year 2000 all time highs.  A bearish candlestick at resistance should be respected.  A gap down below Wednesday low here would be a pretty solid bearish signal.  Any gap down Thursday with a lower close than open would also be a reasonable bearish confirmation of a doji.  Also notice the overbought stochastics, at a lower high placing this candlestick in a bearish technical position.

I think it would be a great piece of ironic market comedy for the bull market to top here with the COMPQ having reached within 0.2% of a new all time intraday high.  It just is so close that it seems like it has to go through.  And the more time spent right under the high, the more anticipating participants have time to join.....only to be disappointed.  

I am not saying that I have a definite opinion here.  What will be will be.  But make no mistake about it here....the market is giving basically every signal it can that a top is possibly at hand.  So profits should be taken.  Then if price does break to new highs in the Nasdaq, it would seem sensible to buy back into the market with expectation of some continuation on the euphoria and late coming dumb money.


Pete


Friday, April 17, 2015

Bearish Divergences Abounding in the Short Term

As of yesterday's close in the SPY and DIA there are many short term bearish divergences suggesting a pullback is close at hand.  Notably...


  • Daily McClellan Oscillator
  • Hourly NYSE TICK index
  • Hourly MACD
  • Hourly Money Flow Index
  • Daily TRIN
This morning a gap down is indicated which would break the hourly chart uptrend lines of the recent bearish ABC pattern set-up I have highlighted.  Given the price logic and the divergences, this gap down may be a sign that the pattern is playing out as expected with a likely move back down to the March lows or lower.

Pete

Thursday, April 9, 2015

QQQ Short Trade Set Up - Price Logic and Bearish Divergence

Click on Chart to Enlarge

The chart shown here is an hourly of QQQ which is the Nasdaq 100 ETF.  For those who have followed this blog for a while and understand some concepts related to price logic and divergences, this should be an interesting pattern to watch unfold.  There is an obvious bearish set up here to short or inverse the Nasdaq if an appropriate signal occurs beneath point 0.

So notice the the move from -1 to 0 was retraced in less time than it took to form.  That indicates a probable short term (at least) pattern completion and the beginning of a new downward pattern in the market of some degree.  Now it is clear that the price action upwards from point X has occurred more slowly and with clear corrective/overlapping swings, suggesting that the move up from point X is probably a correction against a still developing larger downward price trend.

Since the smallest "pattern" that can develop is a 3 wave move, and point X has not been breached, it would seem likely that the next move down is likely to move below point X.  The other possibility from a pattern perspective is that a sideways/triangular pattern is forming within the bounds of points 0 and X.  In that case price would not be expected to break point X.

Now the study below the chart is a money flow index which is basically an RSI of both price and volume combined.  So it tends to be a leading indicator more so that price only based studies like MACD or RSI, etc.  Currently the MFI is displaying a bearish divergence at today's new high for the recent rally from point X.  Now the MFI is not at an extreme level, so it is arguably to significant.  But the other reasonable interpretation is that the current up move is very weak and this is an imminent sign of topping and another directional downward thrust in price.

Analysis is easy.

Consistently making objective buys, stop adjustments, and sells is much more challenging.

So for the trader here this pattern creates a nice set up to short the market or make a stop adjustment on an open short position to above point C if a sell signal is generated below point 0.  Another speculative play here would be to buy put options on the indexes here.  An ATM put option with April 24 expiration would have a very reasonable 100%+ profit potential if prices decline to point X before expiration.

If you have questions or ideas on managing open trades here or entering new positions, comment and we can proceed with further analysis and planning.

Pete

Monday, March 9, 2015

US Dollar Index Showing Bearish Divergence at Extreme OverBought Conditions In Both Price and Time

Commitment of Traders Us Dollar
Click on Chart or US Dollar Index to Enlarge

This chart is a weekly chart of the US dollar index with Commitment of Traders data below.  These charts are available at Barchart.com.  What is apparent is the massive rise in the speculative net long position, mirrored by the massive net short position by smart money/commercials.  So what does this mean?  A few things I believe...

  • First long term, this trend is not done.  There will likely need to be at least a weekly time frame bearish divergence on the technical analysis to end the trend.
  • By all measures, this move is historically extreme.  It is "overdone" and will likely result in a significant correction of the current uptrend in the relatively near term.
A few nuances of the chart suggest to me that the top for this leg up is close at hand.  First, there is a lower high in the speculator's positions in the last few weeks, creating a divergence that is typical of the end of a move, and is seen at all the other tops of importance on this chart as well.  Second, open interest is at a considerably lower point than its peak for the uptrend.  This also shows decreasing participation in the uptrend, and suggests that the leg up is ending.  You can also see the open interest (purple line in middle pane) make lower peaks as price reached ultimate peaks in the past.

So when can we expect the move to end?

One technique I have discussed before on this blog is the use of an upper channel line combined with technical divergence.  


MACD Bearish Divergence UUP
Click on Chart of UUP etf to Enlarge

This chart is the UUP etf which is an unleveraged 1:1 mirror fund of the US Dollar Index.  I have shown an upper channel line in the chart, and price is just below it.  Certainly price could top right here, but a touch of the channel on further strength would be a great exit into strength in my opinion if you are long.

Also note the sharp bearish divergence on the MACD study in the lower pane.  View this as a "set-up" indicating that shorter term signals can be used for exit of longs or entry of shorts.

If the MACD now crosses down it would be a very simple exit signal that I think should be respected.  However, if price breaks to new highs, I would have to suggest covering a short position, but be willing to re-enter if there is yet another bearish signal while the divergence maintains.  

That being said, trying to catch a correction in a trend is not where most people will make consistent money.  The best idea may be to wait for a sell off in coming months, and then get serious about timing entry on the long side in expectation of a break to yet higher high later this year.

Pete

Sunday, March 8, 2015

2015 Stock Market, Bull Market Top - Bearish Divergence


2015 Stock Market, Bull Market Top - Bearish Divergence


It appears likely to me that the current bull market in stocks since 2009 is over or is in its finals stages. Whether it can be prolonged a few weeks or months, is probably quite reasonable, but I doubt that the current 5th year of the decade will have the same shine as it historically has.

There is bearish divergence in price, sentiment and breadth in the market on multiple time frame.

Additionally, price has now made a failed breakout and reversed below prior highs in several indexes, which is a typical topping pattern as smart money sells heavily into new high trying to unload right at the top.

Toward the end of the video above I was looking for some prior published material I posted on crude oil and did not find it in a blog post.  But the information is contained in a video I published on YouTube from June 18th 2014.  The video did not cover the Commitment of Traders data, only the technical analysis and pattern analysis.  So a longer term monthly chart of crude oil with the CoT positions is shown below.  From the green line on the bottom pane you can see speculators' positions reaching new all time highs in 2014 despite lower price peaks compared to 2013, 2011, and 2008.

Crude Oil Commitment of Traders Chart

The point here again is that crude oil price gains were made by speculators buying.  And there is no actual intent for use by the large specs.  It is only leveraged speculation for profit.  And the subsequent vertical price decline in 2014 (similar to 2008) shows the type of move that can occur with unwinding of that leverage with no real tangible demand.  Interestingly, it appears that there are still currently more long contracts held by speculators that there were held at the PEAK of the 2008 high in oil.  So, in the longer term view, it seems likely that oil will continue its bear market - I would guess breaking the 2008 lows, and possibly the 2001 and/or 1998 lows.

So the situation in stocks is that the bull market has been pushed higher on record margin debt, which has peaked (so far anyway) ahead of price - as it has at the last two bull market peaks.  And this fits in with a divergence theory of market trend changes where you will see the underlying buying/selling behavior peak and diverge prior to the price peak and turn.  The following link is from a website that I am just posting to give you a visual of the margin situation.

I don't want to over complicate the situation.  Bull market tops will lull the crowd into risk complacency.  All things move in cycles, and there will be an end to the current upward cycle in stock prices, followed by new cycles again.  So on a pragmatic basis the question is whether you have an objective strategy for exiting this market.  Do you?  

I have suggested various forms of trailing stops that can be used in the market or as an analytical red flag to take action.  I will make an update in the near future with further details of trade ideas and chart points at which I would suggest price has not only hinted, but CONFIRMED that the market is likely topped for investment purposes.

Pete

Thursday, August 21, 2014

Hourly Time Frame Bearish Divergences on SPY - The Current Rally Appears to Be Losing Steam


Click on Charts to Enlarge

These charts are hourly charts, the top one being SPY with a MACD study underneath.  We can see a nice directional advance the last 2 weeks, but now for the first time in the rally, the MACD is not confirming higher highs with price.  So on this short term time frame we are seeing the initial stages of loss of momentum and a potential top development.

The second chart down shows an hourly chart of the NYSE TICK Index, which is a short term measure of breadth in the market.  Again, we see here that the TICK peaked a couple days ago, and the last 2 days prices have been advancing with no increase in the TICK, and TICK currently at a lower peak.  Again, this is a sign that the real directional phase of this rally is waning.

The third chart down is SPY again with a volume and moving average of volume overlay.  Of note here is that the moving average of the volume is also rising to a lower peak and is showing divergence the last couple days.  The interpretation is basically the same, but the thing I find most interesting is that yesterday and again today SPY is hitting fresh all time highs.  And so if there is weakening volume on the breakout, then I question whether the trading algorithms are collectively going to buy the breakout to any substantial level if the first two days at new highs are not attracting larger volume and price movement.  

The bottom chart is the VIX an an hourly basis.  We do see the VIX hitting fresh lows today for the rally, but only modestly so, and in comparison to the VIX low in June and July, the VIX is at a higher level still having a longer term non-confirmation of the price trend at new highs.

So given what I have recently noted regarding the tendency in recent years for swift rebounds the first 2 weeks after a bottom with elevated equity put/call ratios above 1.0, all the above signs would indicate that we could be near the high of the initial rebound.  I don't expect a sharp topping process here, but let's continue to track this 2000 level on SPX for signs of longer term topping or reversal.

Sunday, August 17, 2014

Multiple Time Frame MACD Bearish Divergence on QQQ Suggesting a Possible Bull Market Top

Multiple Time Frame MACD Bearish Divergence on QQQ Suggesting a Possible Bull Market Top

I have published a new technical analysis video covering the Nasdaq, VXN, banking stocks, and housing stocks in depth.  The trend channel and MACD technical analysis as well as broad scale index and sector non-confirmations suggest to me that a major top is indeed in process here in stocks.  That is my opinion anyway from an analysis standpoint.  As always, translating analysis into objective trading is another level, so simply use this info within an objective trading context.

Futures this evening are up, and it will be interesting to see this week whether there is a weekly top reversal candlestick in QQQ.  A gap up tomorrow/Monday followed by a significantly lower close on the week, would fit with the typical topping price patterns seen in markets.  If prices on QQQ this week close below last week's open @ 95.27 after a gap up tomorrow, that would be a weekly bearish engulfing pattern, and that would be a significant price bar given the technical analysis in my opinion.

97.94-98.35 would be the typical topping price range for QQQ given the hourly chart technical analysis in my opinion.  I personally have an order to purchase deep OTM puts on the SPY etf to take advantage of a possible top and sharp decline into the seasonally weak period of Sept-Oct in stocks.

Saturday, March 22, 2014

MACD Multiple Time Frame Bearish Divergence on SPY


MACD Multiple Time Frame Divergence on SPY

This stock market video covers the SPY ETF and explains the current multiple time frame divergence in the MACD indicator.  There are both weekly and daily time frame bearish divergence patterns in SPY which indicate the potential for a significant high occurring at this level.

Additionally there is a minor failed breakout of the March 7th high, and a potential major failed breakout of the January 2014 high if prices continue lower below the 185 level.

Friday displayed a reversal day in SPY with the S&P 500 moving to slight higher highs, but reversing sharply and closing near the lows in a wide range day.

On the balance the technical analysis suggests that stocks are likely in a position to decline from this level, and traders should be in cash or sizing up shorting opportunities.


I wish you all the best in your trading.  If there is anything else I can do to help you develop as a trader, drop me a comment to let me know what it is or check out my trading courses.

Pete

Monday, November 25, 2013

How to Move Stop Losses to Stay With the Major Trend - Stock Market Update 11-25-13

 
Stock Market Update 11-25-13
How to Move Stop Losses to Stay With the Major Trend

 This stock market update video covers multiple time frame analysis of the S&P 500 tacking ETF, SPY.  The MACD indicator is analyzed at the 15 min, 1 hr, 2 hr, 4 hr, 1 day, 1 week, and 1 month time frame.  Bearish divergence is present on the MACD on the lower time frames, warning that the stock market could potentially be ending an uptrend of varying degrees.

However, price is the final say, and divergence patterns can fail to lead to meaningful reversals.  Given that we are currently in the seasonally strong time for stocks and the market is at all time highs with no overhead resistance, this is a distinct possibility.

I also show you a simple, yet very effective way to trail stops using the MACD indicator  relative to price action.  This method will allow you to stay in most large trends and failed divergence patterns until the trend is done or nearly done.

Monday, November 18, 2013

Multiple Time Frame MACD Divergence in S&P 500

Multiple Time Frame MACD Divergence in S&P 500 

This stock market video looks at the S&P 500 across multiple time frames and notes a bearish divergence in the MACD at weekly, daily, and 30 min time frames.  This type of multiple time frame MACD bearish divergence can signal significant turning points as happened in bonds in July 2012.

We review a low-low-high time cycle that suggests a possible time symmetry for Nov 19th as a high point.  Also, we look at bollinger bands and the current action relative to the upper bollinger band.

Stock indexes formed bearish reversal candlesticks (bearish engulfing patterns) today with both technical and sentiment divergences present.  I discuss trading tactics to take aggressive short entries in the market and discuss how to quickly reduce risk, while still maintaining the potential for a large gain.