Thursday, June 29, 2017

No Clear, Consistent Forward Bias Is Evident Currently In My Backtests - SPY 6-29-17

For the last couple weeks stocks have traded sideways which the scans I ran at the time had suggested there would be limited upside.  Then this week a little selling has returned in choppy fashion.

I ran some various scans today looking at current price movements, indicator formations, and real money sentiment.  Most of what I looked at showed forward returns that were somewhat neutral, certainly not tradable from the criteria I like to see.

So currently I am deferring to the last significant studies I noted which were late May and again around the June 9th high in SPY which both suggested a notable bearish skew for 1-2 months.

Despite today's selling the NYSE TRIN indicator dropped substantially which is not a typical pattern of rising on a sell off.  The Nasdaq TRIN is showing a more typical rise the last few days.  I don't know if this oddball reading on the NYSE TRIN adds weight to the idea that a low is not yet at hand.


The VIX chart shown here is showing a pretty typical configuration for a long in an uptrend.  We see a spike of the VIX above the longer term bollinger band while the shorter term bollinger band has risen above the longer term band.  I have shown this indicator overlay many times in recent years, and if you want more info on it you should be able to find related posts using the search bar for the blog.  Search VIX and Bollinger Bands.

Now the VIX has been at an historical extreme low, and so that has figured in to the recent scans indicating a bearish skew for SPY.  So there is some conflict here, but be aware that the short term set up is looking like a buy.


Wednesday, June 14, 2017

Intermediate or Long Term Climax Point In Nasdaq?

Click on Chart to Enlarge

In the past years I have made some note of key points when markets were at an apparent highs as evidenced by a break above one or multiple trend channel lines.  Coupled with divergence patterns at the end of a parabolic type price movement, such breaks may be key inflection points.

The last time I recall making a mention of this on a larger scale was March 2015 in the Dollar Index.
That did prove to be a key market high.

Currently, the Nasdaq chart above has some similar qualities in the strong run up since January 2016.  Over the last week, price did break above a couple high to high trend lines connecting key highs over the last year and a half.

However, price is still 10% or so below a major high to high trend line connecting the key tops since the 2009 bear market lows.  So, this may have some to blow off longer term to the upside.

But given the wide range bearish engulfing pattern at the recent highs, it seems likely to me that this week could be an intermediate high.  The weekly price action formed an outside down day last week in the Nasdaq, and this is a classic top reversal bar.

Speaking of the US Dollar Index, which has trended lower recently as stocks have trended higher, the UUP etf made a major jump in volume today on a decent size gap down, and made a multi month low for the year.  However, price reversed and traded to close near to the highs, forming a belt hold candlestick pattern.

This is couple with clear bullish divergence in the technical analysis of the US Dollar Index and I think indicates that the mid point of the year may be a turning point higher for the US Dollar.  Commitment of Traders data show that the commercial "smart money" traders are more bullish than any time since near the lows prior to major rallies in 2014 and 2016.  So there is still some room in that data before it becomes as extreme as those prior bottoming points, but my point here is that it appears close to a bottoming point and to be alert for long set ups if this is a market you trade in.

Back to the stock market for a moment.......I have looked at the recent charts of the CoT data of the index futures contracts and noted on a few of them, what from my experience and study is a pretty classic blow off move which signals a high.  Basically, the commercial traders usually get more short on market rallies and the speculators get more long on rallies.

But currently over the last couple months, the opposite has occurred, indicating that the speculators "won" and forced the commercials into a short covering rally at which point the speculators have now cashed out rather than continued to follow the trend.

And from my study of the CoT data, this is the historical norm for the speculators to "win" at the end of key trends.  So in actuality the speculators as a whole may be the "smart" money.  Meaning that research into the topic, shows that speculators actually make the profits from the trading in the futures market.  The commercials, are indeed experts in their market, but are using the futures as "insurance" and thus are essentially in the long hull, "losing" money akin to paying an insurance premium for their underlying business.

This pattern is notable currently on the Nasdaq futures contract, which adds further weight to the perspective that the recent top reversal type action in the Nasdaq is legitimate and may hold for several weeks or even months.

Pete

Thursday, June 8, 2017

Expanding Triangle or Diagonal Top Appearing on SPY - Probable Move Down to 232-235 in Coming Few Weeks

Click on Chart to Enlarge

Currently stocks have been moving higher but with notable weekly time frame bearish divergence in MACD on the SPY etf as well as bearish divergence in the breadth.  So fewer stocks are hitting new highs or advancing relative to previous price peaks.

This is classic type technical signals of a topping of a leg up in prices.

I had noted some recent scans which suggested a likely higher downside risk to upside potential.  However, we have seen mostly upside since then.  Though with the low volatility it has not been a big advance in percentage terms.

The 60 min chart of SPY is now again at a point of notable bearish divergence, and so if a multi week top is to form, it could do so here over the next day or so.

On the chart above I have put a pattern labeling scheme.  I put this here because the pattern in play appears to fit the back tests of price and sentiment studies suggesting downside risk over the coming weeks or couple months.  And clear price patterns can give some refined targets or expectations that may help a trader manage the trade more effectively than a purely mechanical or statistical method.

If this move is a "terminal" move then the implication is for a rapid move back to the starting point of the pattern around 232 on SPY.

If this move is a "B" move then it may be a less explosive downwards move back to the 232-235 area as support, but not necessarily back to the 232 level.

From my perspective of observing market price action relevant to price patterns and key support areas, if prices do correct and move below the 232 level, I think that would likely be a temporary climax point where stops would be run under support, and then prices would begin a rebound of some extent.

Pete

Thursday, June 1, 2017

Triple Time Frame MACD Bearish Divergence in SPY - Probably Close to A Significant Intermediate High

As of this morning 6-1-17 the technical analysis of the SPY etf shows weekly, daily, and hourly chart bearish divergence on the MACD.  What does this mean?

The weekly time frame divergence is the longer signal showing both "overbought" levels and new price highs with less "momentum" or rate of change at the newer highs.  This is a longer term signal that often is present at the end of bull markets and often at the end of major advancing phases of a bull market prior to a deep correction (say 10-20%).

The daily time frame basically then shows that there is loss of momentum occurring in the most recent leg up to new highs.

And then the hourly time frame shows that there is loss of momentum in this final little move occurring on the last daily push to new highs since the last cross down on the daily MACD.

So taken together, it is like a multiple waves of different frequencies all coming together at once and reaching a crest.

In my observation for the last 12 years, these points are often significant and should alert to the possibility the market will experience a major correction over the coming weeks/months.

Certainly at times, these signals may be in the middle of a major move up, and the results ends up only being a temporary range bound market before continuing higher.  But factoring in a number of indications of sentiment and breadth, it seems likely to me that stocks will stall and correct a bit quite soon.

It appears unlikely to me that this will be a bull market top.  Particularly with the Nasdaq not displaying any bearish divergence on the weekly MACD, it seems more likely to me that the current position is nearer to the momentum peak of this portion of the bull market, but it could take months and some small to intermediate corrections and breaks to new highs, before a more long term high could be set.

Pete

Friday, May 26, 2017

Further Signs of Intermediate Term Topping and Probable Downside to Come For Stocks 5-25-17

Click on Table to Enlarge

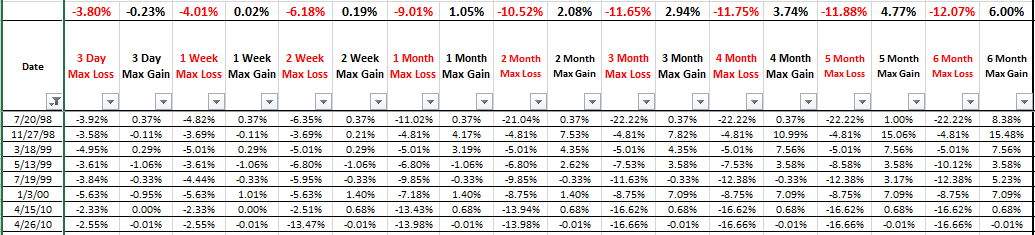
Last week I showed stats from past instances where there was a 1.5% decline in SPY the day after a 52 week high.  And the average displayed a notable bearish skew for the next couple months, though about half of the instances rebounded back to near the highs after that initial big sell off day.

This rebound scenario is what we have seen in the current market.

I have run a couple scans over the last few days, and it still appears that similar past markets have had a notable bearish skew looking forward a few months,

The chart above shows the forward MAX gains and losses from a scan including bearish divergences in VIX, total put/call ratio, volume, MACD and stochastics on daily and weekly time frames.  So basically just an across the board price and real money sentiment bearish divergence.  And the bearish skew is notable for the first couple months.

Another scan criteria looked at unique instances when there was both daily and weekly bearish divergence in the MACD when the VIX closed below 11.  The results were similarly bearish.

There are good trading opportunities here based upon my method and the data at this point.
Based upon past SPY data, shorting here and setting a limit order to cover at 5.75% gain while also setting a 5.75% stop loss would provide a roughly 2.25% expected value over the next month.  The trade would be exited after 21 trading days if neither stop nor limit was filled.

Any where in the 4% to 6% paired limit and stop orders basis SPY would be very reasonable plays.  And 4% the ratio of the risk to the expected value is the lowest, and after that there may be higher expected values with wider orders, but the risk rises more than the expected value increase does.

I am electing to purchase SPXU here and use 12% limit and stop orders.  The simplest way to do this is with an OCO, one cancels the other, order where one order is a sell stop and the other order is a sell limit.  Then set a time reminder to exit on June 26th if neither order is filled already.

For the options side of things, a 130% limit gain order from the closing price yesterday on a 241 strike June expiration put option, would provide a very positive expected value with about a 66% win rate based on past similar instances and the calculation of my algorithm.  For this trade, there is no stop on the option.  It could expire worthless, but a limit gain GTC is set immediately after entry.

Pete

Thursday, May 18, 2017

1.5% Decline in SPY the Day After a 52 Week High - Bearish Implications for Coming Weeks

Click on Table to Enlarge

The above table shows instances in the history of SPY going back to 1995 where a 52 week high was followed the next day by a loss of greater than 1.5%, which is what we saw yesterday in SPY.  This filter also look for only times where there was MACD bearish divergence on the weekly chart at the 52 week high.

From the closing value of the day of the 52 week high, every single instance lost at least 4.8% over the next month of trading. 

Even taking out the filter of the bearish divergence on the weekly chart, the results were that 11 out of 12 previous instances declined at least 4.8% over the next month.

So this adds further weight to the outlook I posted earlier today based on the more subjective qualitative price pattern and a general view of conditions.

So given this back test, it is putting us on alert that stocks are likely to fall a few more percent in coming weeks.  And a few of the past instances led to sizable corrections of 10-20%

About half the past instances showed an approximate 1 week rally to back near the highs after the first 1-3 days of decline, before then selling off strongly again.

The other half of instances basically had no substantial bounce after the initial big down day.

If there are questions about how to make a trade with stops and limits here, comment.  But the idea is that after a little further decline over the next 1-2 days, stocks rebound for a few days, and that may be an ideal time to use an inverse ETF to try to capitalize on probable further sell off.


Pete

Stock Market Expectations 5-18-17

Yesterday saw an oversized sell off in stocks compared to the recent low volatility trading.  But as mentioned in the last post a couple days ago, there were indications that a high was to be expected and that stocks were ready to correct.

So the question now is really what the probable future course of action will be.

I have run some backtest scans comparing the current market position to the past trading history of SPY, and I would have to conclude that there is not a clear directional bias based on the past tests.

Obviously the sharp sell off yesterday has a short term bullish perspective when looked at on its own.  But some of the other recent comparisons I've made have shown consistent muted upside for a couple months after the recent really low volatility type readings we've had in the last couple weeks.

Click on Chart to Enlarge

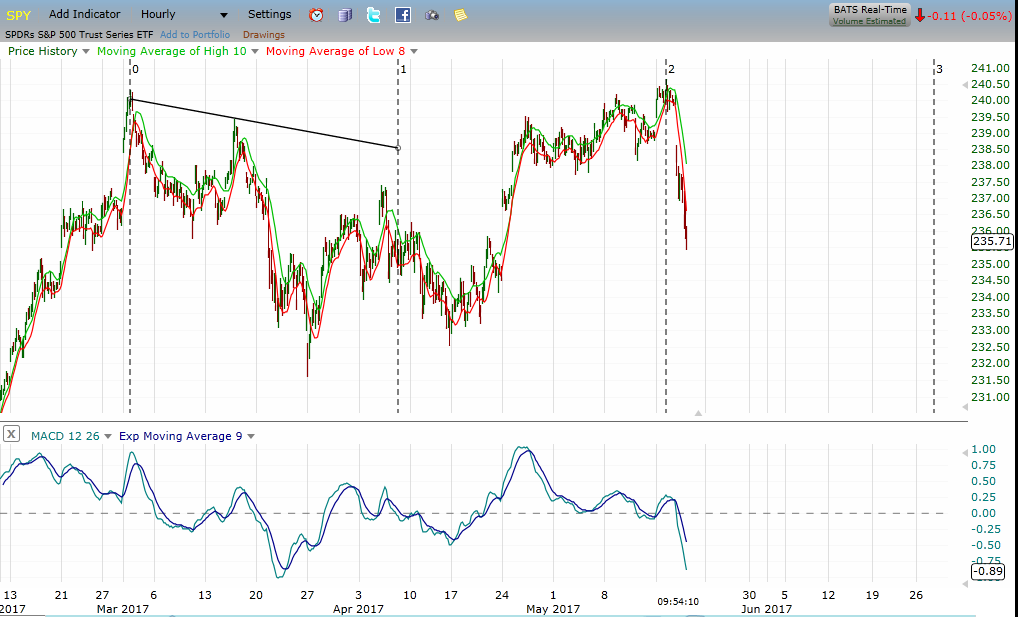
This is an hourly chart of SPY.  And the pattern here, from my perspective would suggest that there is a downside bias through June, with a possible low forming in late June.  And that would fit with a typical correction in stocks.  Historically, a median correction in the SP500 is about 6 weeks and about 11%.  This is for corrections that last greater than 1 month from high to low.

So given that we are in the seasonal "sell" time frame, and the time and structure of the pattern here near the recent high, couple with the technical analysis of weekly time frame divergence on the recent poke to new highs, I will proceed with an outlook that the downside risk still is greater than the upside potential for the next few weeks.

Looking at the MACD in the hourly chart above, we can see that it is "oversold" but with no bullish divergence yet.  I would certainly expect that a divergence will form on this time frame before a nice rally could ensue.  So, it appears that price still have at least some work to do here to the downside before a multi day low could form.


Pete