

I started this post yesterday and then part of it got deleted accidentally and then I got predisposed and didn't finish.
Well, the BGZ posted stop was hit yesterday for possibly the world's worst trade. The posted exit will be the opening price of 27.63 yesterday. If you were clever enough to set your own stop at better prices, then that's good. I wasn't so clever, however, I may just be clever (or dumb?) enough to get back in today with a stop a penny below today's low in BGZ due to the pretty nice, high volume shooting star right at major resistance that formed yesterday coupled with a bunch of intermediate overbought indications.
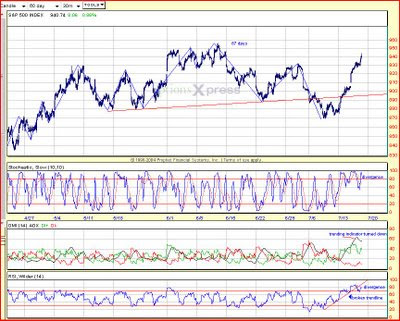
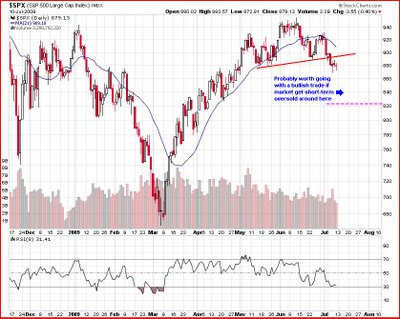
The evidence is starting to mount that the market is reaching an intermediate term overbought condition. I will try to cover a bunch of data in a video this weekend, but as funny as it seems, the market has gone from modestly oversold to significantly overbought without barely a breather in the space of just over 2 weeks. The S&P 500 approached the 1000 mark yesterday which based on some Elliott wave pattern interpretations would be an idealized ending topping point for this rally. Also as shown above, as the market move into the 1000-1040 range there is major horizontal resistance, the type which has led to pullbacks so far on this rally.
Other factors of note.....The top picture above is the most recent Newsweek cover. Thanks for letting us know. I'm sure the call will be timely as you and other fine mass media publications have such a good track record at early identification of economic and investment trends. (Hopefully you caught the sarcasm). For anyone who has not heard of the "Magazine Cover Indicator" you probably should google it when you have 5 minutes that you aren't going to use productively. While this is not as provactive maybe as some past notables, the magazines sell what people want to hear and believe. It is obviously yet to be seen if this will be added to the list of obviously stupid and dead wrong timing covers from the past, but it is interesting none the less.
Also shown above the AAII (individual investor) survey took a huge jump in bullishness this week and is now almost 2 standard deviations from its 1 year mean. Bearish opinion made a corresponding large drop putting the bull ratio at its highest level since last spring just prior to the May 08 market peak. The current level is not too extreme in the history of bull markets, but it is still enough to worry about a rally's legs for someone with a shorter term time frame.
The bottom chart shows a 60 min chart of SPY. I am just noting that yesteday was the 2nd biggest gap up in the recent 2-3 week rally. Seeing as there was lack of follow through during the day, a close below the open, approach of major resistance, and extreme short-term overbought conditions, this may be an exhaustion gap. They typically occur at the end of an advance and occur in conjunction with a "news" item (in this case unemployment data). IF it is, then prices will probably close below that gap in the next day or two. I'm not necessarily saying this will be a major top, but it sure seems like some significant consolidation or give back will have to happen to refresh interest from the smart money.
I'm still awaiting a legitimate oversold signal on the SDS trade to post an exit there.


