In reference to the recent post I made regarding the Put/Call ratio sell warning for the S&P 500, my option limit order did not fill on Friday and I have decided to change the order to a limit order to buy the Feb 20th SPY 210 put for 3.65.
So the strike price is changed as well as the limit order.
This is based off SPY rising $2.00 (or almost 1%) further from current levels before topping. Even the most skewed negative future returns after these signals have seen brief 1-2% rises before peaking prior to a meaningful pullback.
The exit order would be to sell at a limit of 8.00.
Sunday, December 28, 2014
Silver Set for Possible Vertical Rally
A week or so ago I posted about silver on TradingView and I did not repost here yet. However I view this as an exceptional profit opportunity. It appears likely to me that silver is set to rally for the next several weeks.
I have both in the money $15 strike, and OTM $17 strike calls on SLV. I would suggest Jan 30 through March expirations as possible time purchases.
Pete
I have both in the money $15 strike, and OTM $17 strike calls on SLV. I would suggest Jan 30 through March expirations as possible time purchases.
Pete
Friday, December 26, 2014
Sell Warning From Put/Call Ratio
On Wednesday the total put/call ratio gave what I would consider a sell warning for stocks. Going back to the 2007 bull market high, there have been 22 unique instances of these signals.
The average maximum decline over the next 2 months has been 8.15%.
Out of the 22 instances 16 have showed greater maximum 2 month future declines than gains. So the "win %" so to speak, is 72%.
On the successful instances with clearly skewed future results towards the downside, the top in price for the next 2 months has typically occurred from within a couple days to 2 weeks.
Going back to Christmas 2009, the average max decline over the next 2 months on all unique instances is 7.77%.
There have been 4 other instances around the Christmas holiday where signals occurred going back to the 2007 market highs. They lead to max 2 months declines of -5.52%, -3.87%, -7.22%, and -14.42%. The biggest decline here occurred in the last bear market. The other 3 were during the current bull market.
So what's the conclusion?
It seems like the odds favor a pullback over the couple months. Given the current sizable unfilled gap up on SPY on 12/18/14, that seems like a sensible price target for a typical pullback. That is at the 202ish level on SPY and would represent only about a 3.5% decline from current levels, so it seems well within reach given that the average max decline even in the bull market so far is about 5.5% for similar signals.
From reviewing past instances, most of the subsequent pullbacks from these signals, made bottoms in the 1st week of a month 1-3 months down the road. So for put option speculation it seems like a Feb or March expiration at the money put, would be sensible and given solid odds on a 100% or greater return with apparent odds of success at around 70% based upon past instances.
From the close of the day on which the first of a cluster of similar signals occurred in the past, successful near term tops, have often occurred within 1-2% above the first signal day.
Given the current signal and the potential time frame for a pullback, I am putting in a limit order to buy SPY Feb 20th expiration puts, the 209 strike at 4.00. Then the exit order will be a limit order of 8.00 to sell prior to expiration. That would necessitate probably only a little less than 4% decline in the next 7 weeks to achieve the 100% return.
Pete
Wednesday, December 17, 2014
SPY Oversold Going into FOMC Announcement 12-17-14

Click on Chart to Enlarge
As of yesterday's price action, SPY was oversold and showing bullish divergence on the hourly price chart. Today is the FOMC announcement and so there is the possibility of a news-driven sharp move here. Given the technical set-up, it seems likely for a rebound attempt. A major downer would be unexpected here, but could be of longer term significance.
There has not been a bottom reversal signal in my SPY trading system currently, and there has been no bullish divergence to develop in the underlying real money sentiment analysis. So in the past that has typically meant that we see at least a slightly lower low before a reversal occurs. If that occurs followed by a reversal bar, we likely will see a signal occur and it so, I will note it with some detail on the significance and how to trade it, if at all.
Additionally, the VIX/VXV ratio has closed above 1.00 for 2 out of the last 3 days before today, and as I have noted repeatedly on this blog in the past, that often occurs just before an important low occurs. So really, it means that you take any objective long trading signals generated here. The signals dependent upon your plan and trading method.
Further understand that we are entering into a positive seasonality in the end of year time frame, which would just again be another confirmation that long signals should be acted on. And a stop is always used in case of a major surprise or trend shift.
Pete
Thursday, December 11, 2014
Short Term Stock Market Update
So far on this small decline the last few days, there has not developed a bullish divergence of the type that typically leads to a bottom. So I expect at least modest further declines here. My general feeling is that stocks will continue to move at least modestly lower into next week's FOMC announcement at which point the stage may be set for a bounce from oversold conditions at least temporarily.
I may post signals of my personal trading system if any are generated in the next few days.
Also I would like to get a post up regarding some longer term cycles at play here. But in short the 5th year of a decade, and the current portion of the presidential cycle are both historically bullish. So while the technical aspect of the market is once again at a multiple time frame bearish divergence indicating a probable correction or consolidation, if prices break to yet higher highs later this month or into next year, it may be that price will enter a very directional period of market gains.
But without getting too far ahead of our selves, the first thing to watch for at this point is a daily reversal bar and also the development of shorter time frame bullish divergences (hourly, 30 min, etc) on SPY or other index ETFs.
Tuesday, December 9, 2014
Cotton and US Dollar Index
At the suggestion of a reader (Thanks Tim), I recently started doing some charting on TradingView.com It has a lot of great charting features. It currently lacks in ability to save many charts and layouts as a free service, but the charting features and ability for ratio charts and custom indicators is a big win for a free service.
Anyway, I will post links here to a couple recent posts that I have made via trading view. The markets are cotton and US Dollar index. In short, the US Dollar appear to be topping on this rally and set for a significant consolidation. Commodities in general appear set to rally.
Cotton and gasoline are 2 markets that I really like the CoT backdrop for forming big rallies to come. I have already noted the bullish set-up in metals in recent weeks and months, and those markets are generally conforming to expectations as noted here.
Here are links to the TradingView posts.
Cotton
US Dollar
Let me know if there is any trouble viewing this, as this is a new feature for me to use.
Pete
Sunday, November 23, 2014
The Down Trend Is Ending In the Yen - Signs of Exhaustion in the Commitment of Traders Data

Click on Chart to Enlarge

Click on Chart to Enlarge
The chart on top is the FXY etf which is the Japanese Yen. The lower chart is the CoT data, but it covers a longer time period than the top chart, so checks the dates for correspondence.
I am pointing it out here because it is displaying one of the most significant and sure signs of exhaustion there is based upon the Commitment of Trader's data. So this trend appears to be ending, and one could look to initiate speculative longs soon with outstanding reward to risk ratios.
Of note is the horizontal support line. The low at the beginning of 2014 marks the point of maximum net short by speculators. This can be seen in the chart of the CoT data below. That point is a multi year extreme in net short by large specs. Even on the move to lower lows in FXY, the specs didn't get more short, so this shows that their selling capacity is exhausted - it is a type of divergence or non-confirmation with the price trend.
Now the other interesting thing here is that when price broke that horizontal support, it led to the smart money/commercials, actually having to sell into lower prices for a few weeks, which is opposite their style. This is a hallmark of the end of a trend when the commercials have to capitulate and take a massive loss.
I will link here to a post I made about cotton in 2011, because it accurately showed this pattern in reverse - as a topping pattern - on this blog as the top occurred in cotton before a massive bear market took place in the following year or so.
So one could look here to short the USD/Yen pair on appropriate signals. Also one could look to buy FXY call options with several months to expiration with strikes in the 80-85 range after careful analysis. Also, YCL is a 2x leveraged bullish Yen fund, which would be used as a leveraged equity play to go long on appropriate signals.
I personally am looking at some call options on FXY, but currently have no position.
Tuesday, November 18, 2014
Gold, Silver, Steel Long Opportunities
I made a video over the weekend covering in detail the technical situation in gold and gold stocks, silver, steel stocks, and gave some ideas on individual companies to look at for trading purposes. However, the jack on the audio is not connecting and the video has no sound so I will give a brief recap here.
It appear likely that gold and silver have made bear market bottoms and the recent explosive upward days in those markets shows what I believe is the beginnings of a swift short covering rally which will lead to directional gains over the coming weeks in gold, silver, and related miners.
Specific stocks that I like the looks of at this time are MT, SID, NG, FSLR, SPWR, MGM, HHS for longs.
ETFs I like right now are GDX, SIL, UNG, SLX, DBA for longs
In order to find potential trades at this time I would recommend using screens with the following parameters:
1) Screen the gold, silver, and steel industries for stocks with price/book ratios less than 1.0
2) Screen the same industries and sort them by dividend yield. The highest dividend yields may be some of the bigger companies which are undervalued and are potential multi year holds. Screen these companies for tradable patterns or technical set-ups
3) Screen the above mentioned industries for short interest ratio. The higher the short interest ratio, the more likely there will be forced buying added to the expected underlying rally in the metals and shares. The higher short interest can lead to fantastic short squeezes but also generally coincides with increased volatility, so from a risk/reward basis it may not mean much. But from an investment standpoint, if you created a basket of the highest short interest stocks in these industries right now, I think it will out perform the underlying metals or miner ETFs.
Let me know if you need any other further info or analysis here and I will try to do it in timely fashion as with a swift short-covering rally, each day that passes may significantly shift the near term reward/risk in a less favorable direction.
Pete
Friday, November 14, 2014
A Few Charts of Interest in Commodity Related Stocks
As the commodity board appears to be bottoming for the intermediate term, there are several ways to screen for trade candidates. At this time I would suggest screening stocks in the gold, silver, oil, and steel industries for short interest amongst other technical factors. The heaviest shorted stocks can really strongly rally after a low occurs and the markets rally into the short squeeze price region.
Some charts of interest are NG, MT, SID, OIS.
There are plenty of solid looking technical opportunities out there right now that could be traded according to an objective technical method. The key will be in risk management. How much capital is appropriate to put in play at once as a bottom attempt occurs? That is a great question. One idea is to begin with a hourly chart and place a trade. Then if the trade is successful, and the trend continues, you can take another trade on a daily time frame signal when it develops. And again, on appropriate patterns, you could also add another position if the weekly time frame signal occurs as the trend continues. It could be done with a simple technical indicator like MACD, or other more complex strategies. For a purely technical trade I like to use a moving average channel breakout after a technical divergence to be my entry signal. Then I use the moving average channel itself to trail stops as the trend develops.
Pete
Wednesday, November 12, 2014
CRB Commodity Price Analysis and DBA Price Logic Trade Example

Click on Chart to Enlarge
This chart is the CRB commodity index with a weekly time frame showing the RSI. Notice that the weekly RSI is oversold for the last few weeks. Also notice the last time in early 2012 that a weekly oversold reading occurred, commodities rallied in extreme fashion in the coming few months.

Click on Chart to Enlarge
The is the CRB on a daily time frame. Notice the RSI not moving above the 50 level during this decline. However there is a building divergence in the RSI, which, if followed by a move in the RSI above 50, would be a likely sign of a breakout to the upside in my opinion.
Additionally, there are many commodities with either record net long commercial/smart money positions, and some with bullish divergence in the commercial/smart money net positions. Coupled with the current oversold condition and daily time frame divergences across the board, I am suggesting to prepare for a major commodity board advance in coming months.
I have recently taken a position in DBA based upon a price logic set-up and a non-confirmation of DBA with the broad commodities. So DBA recently made a higher bottom last week as the CRB was making a lower low. This hints at strength in this index (DBA).

Click on Chart to Enlarge
This is the hourly DBA chart. I entered at 25.52 with the original stop at 25.22. The stop has now been moved up to 25.30. If the price rally happens to retace above the Oct high in less time than the recent decline took to form, then I will hold the position and trail the stop on a daily time frame. If price rally more slowly I will exit at any hourly divergence that forms at a lower high below the Oct high. And obviously as I trail the stop up, it is possible that the position gets stopped out in the interim.
So we will see how this develops, but the general dual time frame set-up here with weekly over sold, daily bullish divergence, and a non confirmation from DBA all suggest a quality opportunity. So I have just entered on the hourly chart for a position that could be a daily or weekly time frame hold. Assuming prices rally, a simple scale out can be used, but I like to incorporate the price logic analysis into the trade follow through so that if a strong new trend occurs, I don't exit part of the trade on the smaller time frame. That is why I plan to hold and use the daily chart trailing stop method if price rally quickly above the Oct high.
Pete
Thursday, November 6, 2014
Gold and Stock Market Update
As of today, 11-6-14 both gold and silver have triple time frame MACD bullish divergences on the weekly, daily, and hourly charts. So I am keeping a close eye on them for bullish reversals in the price action. Any daily reversal candlestick pattern could be used as entry. Or an hourly chart breakout/momentum signal could be used as well. In these types of cases, assuming a buy signal is given, the stop is placed below the low, and then a portion of the trade is exited by using the hourly chart to give stop movement and/or exit signals. Then a portion is held using the daily chart for signals. I have given ideas on how to trail stops using MACD or moving average channels in the past.
Also for the US stocks, the hourly chart bearish divergence is pretty mature right now, so we are probably very close to a short term pullback in stocks. However, given the strength of the rally and no divergence on the daily chart, it seems unlikely to me that a top of major significance could be made until at least a couple more weeks pass and some daily time frame momentum begins to show divergence.
Also USO/oil prices are showing a very nice daily/weekly dual time frame stochastics set-up today for a long trade. Weekly stochastics is oversold. And the daily is oversold with bullish divergence and made a bullish reversal yesterday. A move above yesterday's high in USO would be a buy signal with a stop below the lowest point of this decline. A currently have an order in UCO to go long on a move above yesterday's high.
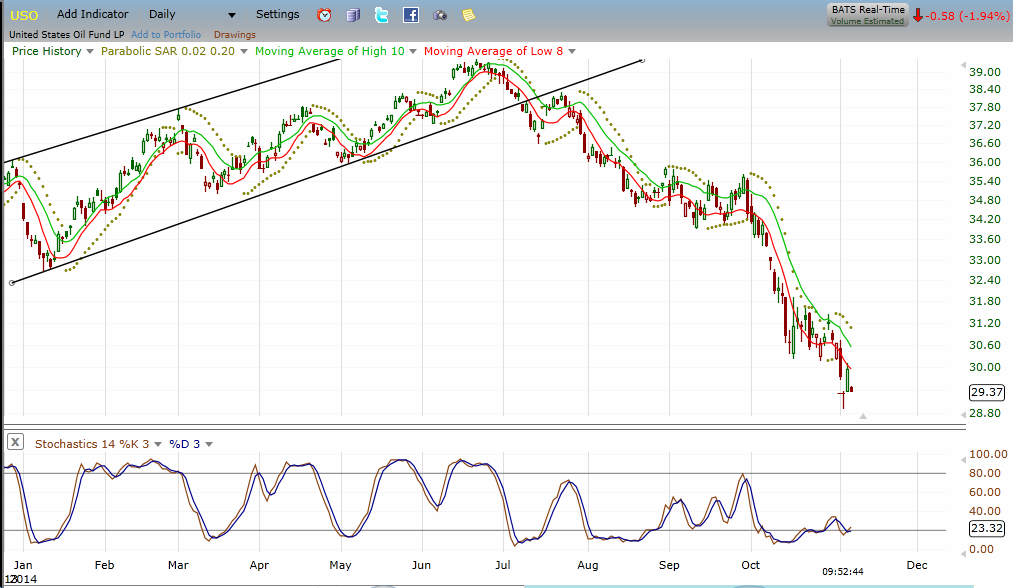
This is USO daily chart showing the stochastics below which has bullish divergence. Multiple commodity markets have the underlying technical and smart money sentiment to stage major rallies.
Also for the US stocks, the hourly chart bearish divergence is pretty mature right now, so we are probably very close to a short term pullback in stocks. However, given the strength of the rally and no divergence on the daily chart, it seems unlikely to me that a top of major significance could be made until at least a couple more weeks pass and some daily time frame momentum begins to show divergence.
Also USO/oil prices are showing a very nice daily/weekly dual time frame stochastics set-up today for a long trade. Weekly stochastics is oversold. And the daily is oversold with bullish divergence and made a bullish reversal yesterday. A move above yesterday's high in USO would be a buy signal with a stop below the lowest point of this decline. A currently have an order in UCO to go long on a move above yesterday's high.
Click Chart to Enlarge
Thursday, October 23, 2014
First Signs of Divergence on This Rally - SPY 10-23-14


Click on Charts to Enlarge
These are hourly charts of SPY and the VIX. They are actually now showing a reasonable divergence pattern to set up a short trade. However there are relatively mixed currents of momentum on the different time frames which suggests to me that we are likely to see continued trading mostly within the range of the last 6 trading days for probably a few weeks to come.
Of note on the charts are the divergence in the momentum indicator relative to SPY. And on the lower chart, the VIX did not confirm a lower low this afternoon as SPY made a higher high. These VIX non-confirmations are often leading indicators of a reversal attempt.
Not shown is the hourly total put/call ratio chart which nearly touched the bottom bollinger band this afternoon and is further indication that this move is now stretched to the upside for the short term.
That being said there is no downside breakout on this hourly chart to suggest that a significant move is underway.
After similar sell-offs to the recent October plunge, the sharpest portion of the rebounds have occurred in the first few days, likely as short-covering rallies. Once that initial short-covering is exhausted, we will likely see at least a 1-2 day pullback, possibly quite sharp. However, a subsequent move to yet higher closing highs, would be indicative of legitimate market interest on the long side in my estimation.
Tuesday, October 21, 2014
Bought SPXU @ 48.63
Just for FYI and disclosure, I bought SPXU shortly after the open at a price of 48.63.
This effectively is shorting at this mornings gap up opening. The gap open occurred above the 191.00 level which I thought may be resistance here, and price is also testing the 10 period moving average of the daily highs. Given that the weekly MACD is down, and the daily momentum is below its moving averages and without divergence, I view this as a high probability set-up for a pullback to occur in SPY.
I don't have a stop on the position, so if you are using this info for trading decisions you need to determine your stops and position sizing, etc. I find that when trading mean reversion type strategies like this, the overall profitability is higher without using a stop. So you control risk through position sizing/ capital exposure rather than via the stop price.
If the hourly time trade chart generates an effective sell signal on price action, then I will place a stop on the position and await a short-term extreme pessimism to exit the position at.
Start a comment dialogue below if you desire more information or assistance here.
Pete
SPY Short Trade Set-up


Click on Charts to Enlarge
The top chart here is a 30 min chart of SPY. The MACD is elevated as price is reaching the 191 area that I have highlighted in recent posts. I view this level as a shorting set-up and may track some trades here based upon short term technicals and real money sentiment.
The second chart is the VIX on an hourly time frame. The set-up here would be for the VIX to touch the lower 20 period bollinger band which would be an indication of a potential short term extreme to act upon in contrarian fashion, assuming the larger trend is down, or that a retest of the recent low will occur. The best set-ups occur when price pushes higher but the VIX fails at least in a very minor way to continue lower as price moves higher.
The bottom chart is the total put/call ratio on an hourly time frame. Again a move outside the lower bollinger band here would be a possible short term topping signal, though it won't necessarily mark the precise high.
Prices are set to gap up here, and in my opinion a short position at the open would be a reasonable play. If I go in here it will likely be with SPXU and without a stop on the position. I will wait for an opposite extreme to develop and exit or place stops when that occurs.
Saturday, October 18, 2014
SPY Price Projection for The Rest of 2014

Click on Chart to Enlarge
Over the last couple days I have created what I believe would be a relatively close projection of upcoming market activity IF...... the bull market high has completed in September here in the S&P 500.
Without spending a lot of time covering everything that I've looked at other than the few posts I've recently made about the subject, I will give a few key summary points.
- While the current market decline is larger and faster than anything we've seen since 2013 began, it is not larger than the May-June 2012 decline and certainly not larger or faster than the August 2011 decline. So it is unlikely from a logical standpoint, that the bull market psychology is complete - EVEN IF the price high has already been made. This makes it more likely that price may consolidate to a lower high before a much larger and faster downward price move occurs which creates logical confirmation of a new bear market.
- Seasonal tendencies are for market lows to occur in October and to experience rebounds. Also seasonal tendencies are for markets to rally or hold up well into the Christmas/New Year's time frame.
- Real money sentiment is clearly stretched to a statistical extreme of pessimism given the bull market trend. And since the price psychology has not clearly turned down, it seems likely to me that the market will rebound, but the rebound may now take on a more corrective/overlapping character rather than a V-bottom or sustained directional rally off the low.
- The move down off the September high appear to have an expanding bias, and tops or bottoms are more likely to end with a contraction (like an ending diagonal, etc). Expanding activity is more indicative of a new pattern or trend. So I think it is likely that the recent low will be retested or slightly undercut before a more lasting rally occurs.
- There is not yet daily time frame bullish divergence on this decline, making it more likely that prices will retest the low or remain rather range bound for several weeks as opposed to a V-bottom.
- The VIX/VXV ratio has been above 1.00 for several days which suggests to me based on past behaviors that prices are likely to stabilize. The ratio has not tended to stay above 1.00 for weeks, and even if volatility remains higher, it would make more sense here that the initial directional move is largely done and some decline in the ratio is expected.

Click on Chart of LQD/JNK to Enlarge
This chart is the LQD fund divided by the JNK fund. LQD is a lower interest "safer" fund. JNK is a higher interest "riskier" junk bond type fund. The chart has a few notes, and maybe I should have made the chart of JNK/LQD for easier comparison with price, but the obvious point here is that at the September price peak in stocks, the risk behavior did not increase. In fact there was the most pronounced divergence in several years. That has now created the largest rise in the ration in 3 years. If there is a consolidation followed by a new high for this LQD/JNK ratio, we would have added confirmation of a new dominant trend in market psychology and interest rate behavior towards risk aversion and a flight to safety. This would make sense if stock prices have peaked and headed lower in coming months.

Click on Chart to Enlarge
This chart is similar to the last one but shows the risk behavior divided by the safety behavior. This chart is the XLY consumer discretionary fund, divided by the XLP consumer staples fund. From the chart, it is evident that the ratio has expanded as the bull market has progressed. Then, at the summer highs, the ratio peaked sharply lower than in the spring. This has now been followed by a break lower in the ratio. Again, this is a simple measure of risk versus safety investing, with the indication that a new trend towards safety and away from risk is likely at hand.
Now another chart that looks essentially the same but I won't reproduce here, is the Nasdaq volume/NYSE volume which again shows an element of growth versus safety. That chart also did not make higher highs this summer compared to this spring. So here again, there is some indication of waning activity in the more risk/growth oriented stocks versus the more stable, lower risk stocks.
All of these indications suggest to me that the shift towards bear market behavior is on and prices have likely peaked. We currently have an initial price burst to the downside suggesting a top may be in place as well. So I will move forward under this outlook, with the major goal of identifying high quality times to short the market or purchase put options in anticipation of a major move to the downside in stocks.
Friday, October 17, 2014
Current Action in Market Compares to January 2008
The last 2 trading sessions in SPY were kind of unique in that both saw sizable gap downs of greater than 1% and both rallied to close above the open and above the mid range for the session. And Wednesday made a 3 month price low.
The only other instance of this I can find going back 10 years is the Jan 22 and Jan 23 of 2008 instance. That decline really was the kick off of the bear market and made a larger and faster type of decline and undercut existing support from the bull market. Our market is similar in that regard right now as well.
So based upon that precedent, my last post still is my best projection here. The specifics of the price action following the Jan 2008 waterfall decline were an initial 7 day rally (after the two gap and reverse days) followed by a month and a half to retest the Jan 22 low. Then a 2 month rally occurred and gave a great shorting opportunity.
Given our market today has experienced less time since the high and the pattern structure seems different, I think that we are less likely to see a drawn out consolidation at this level and more likely to see a 1-3 week rally followed by substantially lower lows.
I will update as appropriate when action unfolds, but for now it looks like we should be ready to short the market next week for an expected retest of this week's low.

Here is the chart of the 2007 bull market top and the decline into Jan 2008 and the following retest and rally.
The only other instance of this I can find going back 10 years is the Jan 22 and Jan 23 of 2008 instance. That decline really was the kick off of the bear market and made a larger and faster type of decline and undercut existing support from the bull market. Our market is similar in that regard right now as well.
So based upon that precedent, my last post still is my best projection here. The specifics of the price action following the Jan 2008 waterfall decline were an initial 7 day rally (after the two gap and reverse days) followed by a month and a half to retest the Jan 22 low. Then a 2 month rally occurred and gave a great shorting opportunity.
Given our market today has experienced less time since the high and the pattern structure seems different, I think that we are less likely to see a drawn out consolidation at this level and more likely to see a 1-3 week rally followed by substantially lower lows.
I will update as appropriate when action unfolds, but for now it looks like we should be ready to short the market next week for an expected retest of this week's low.
Click on Chart to Enlarge
Here is the chart of the 2007 bull market top and the decline into Jan 2008 and the following retest and rally.
Wednesday, October 15, 2014
Projections for SPY Based Upon Recent Price Action

Click on Chart to Enlarge
My post earlier today appear to have been timely for the short term trade, as stocks reversed most of the day's losses after this morning's sell off. It likely will prove to be a short term low that holds for a little while.
However, the current explosion in volatility and persistent downside price action that has repeatedly closed below the lower bands, with sharply increasing volatility, has led to rather predictable price action in the past. I would encourage you to go back through this post I made in August 2011 during that waterfall decline, because I accurately forecasted price action based upon prior instances of similar action. And that forecast being spot on just adds further weight to the likely outcomes here, with history as a guide. So the implication here is that if today's is a bottom of this initial plunge, but the correction does make a lower low, then we may see prices rally back to the region of Monday's high and find resistance there. Interestingly that area is exactly 61.8% of the retracement of the last 5 days action since the high of point "d" as I have labeled it on recent charts - the 10-8-14 high.
This post shows the trade set-up I mentioned at that time as the initial rebound unfolded.
Here is a follow up post from the action as it unfolded in August 2011 and led to a new low for the correction which ended up being a major buy signal.
The chart above shows a projection similar to the ones linked here, and is based upon a rally to the high of the second candlestick before today's reversal. In the past when no divergence is present, the market has routinely retested the low before rallying again. So in this case we may expect a similar outcome. Each rally here would be a short-term short trade set-up. And if the bull market has topped, then the next break of support may be significant and lead to much further losses. But the technical indicators and underlying sentiment will be our guide as we move forward assuming this forecast is roughly accurate again.
The initial rebounds after a sharp decline like this tend to be swift. I would expect a short-term short sale opportunity to develop by next week.
As a side note, there is perfect hourly time frame bullish divergence on IWM currently and a bearish engulfing pattern on the daily chart just below support. So it would be logical to go long IWM if one were to believe the bull case here. You can always treat it like a short term trade and exit part at the first sign of hourly time frame overbought levels. Then maintain a portion of the trade for a potentially larger advance if the market does put in a lasting low here today. In these scenarios I go in with the expectation that I may only breakeven most times, but I will be in the market for the times when it does put in a lasting low,
Again, comment or question below if you need further assistance in navigating here based upon your trading time frame, etc.
Pete
Expanding Pattern Now At An Extreme - Short Term Cover Point
If you followed my posts the last couple weeks or took advantage of an option play to profit on the last several days of decline, then my suggestion at this point is that price has now declined to the declining speed line of the expanding pattern boundary and has occurred with a sizable gap. There is no bullish divergence present at this point to suggest the decline has bottomed, however, I would suggest that this may be a quality point to cover part of a short position or put option, depending on time to expiration, etc.

So again, I am not saying that today is a price bottom and I am not suggesting going long here. I am saying that when the crowd is panicking and prices are making an extreme, those are the most contrarian points at which to act opposite the crowd. In this case that means to cover or exit as they are capitulating.
In this specific case, I believe any rebound will be another shorting opportunity, but I will obviously be better informed as more price and time action unfold. If a major decline is infolding, I don't expect any rebound to go back to the "d" wave high. So if a rebound occurs and gives a sell type signal below that level, then I would suggest to short/sell.
For now a sell and hold strategy may be rewarded, but I have a feeling from years of close market observation that the short term downside is likely mostly done. I could always be wrong. and that is why I typically stress using a trailing type stop mechanism on part of positions that have major price potential. I think that would be advisable here, but for options you may not have that luxury due to time decay.
Let me know if you have any questions regarding how to navigate here.
Pete
Click on Chart to Enlarge
So again, I am not saying that today is a price bottom and I am not suggesting going long here. I am saying that when the crowd is panicking and prices are making an extreme, those are the most contrarian points at which to act opposite the crowd. In this case that means to cover or exit as they are capitulating.
In this specific case, I believe any rebound will be another shorting opportunity, but I will obviously be better informed as more price and time action unfold. If a major decline is infolding, I don't expect any rebound to go back to the "d" wave high. So if a rebound occurs and gives a sell type signal below that level, then I would suggest to short/sell.
For now a sell and hold strategy may be rewarded, but I have a feeling from years of close market observation that the short term downside is likely mostly done. I could always be wrong. and that is why I typically stress using a trailing type stop mechanism on part of positions that have major price potential. I think that would be advisable here, but for options you may not have that luxury due to time decay.
Let me know if you have any questions regarding how to navigate here.
Pete
Monday, October 13, 2014
3 Year High in Total Put/Call Ratio Today
Today the CBOE total put/call ratio spiked to 1.53 which is the highest it has been in over 3 years. Also the VIX is nearing levels last seen in the very large correction in 2011 where SPY declined 21% in 5 months from top to bottom.
So what is the significance of this reading? Well for those who follow this blog closely, you know that I always point out the importance of divergences occurring at market turns. And when we see a new extreme like we are in the put/call ratio, that is telling us that "fear" is high, but the fact that there is no divergence present, it indicates that the correction has NOT made a low.
So from this point, we may be close to a rally attempt after a big downer like this, but in my opinion, the rally will be a shorting opportunity on at least an hourly time frame basis.
Given the larger pattern at play here (possibly an ending diagonal in the Dow 30), prices may decline relatively sharply all the way back to the Oct 2013 low. That would be another 10% lower in the Dow 30. So just be aware here that if a bull market top is in place, the whole character of "oversold" will take on a new meaning over the coming weeks.
I will continue to update here at potentially important market turns and try to offer contingency plans at each event.
Pete
Expanding Bias Confirmed in This Decline - Look Out Below?
As of this mornings trade in SPY, it appears that the correction is developing with an expanding bias as suggested in the last post. The ends of expanding downside patterns can really end with sharp downdrafts. At this stage I am more or less expecting that.
The break of the August low today is a notable chart occurrence and may lead to some buying and an attempted reversal. I will post if there are legitimate reversal attempts according to my methods. At this point hourly time frame momentum and MACD, etc are very oversold, but they are not showing any divergence. So I would advise against believing that today is a bottom day even if a reversal attempt occurs. The odds just consistently favor divergence to appear at the significant market turns.
For now if you look at the weekly MACD and stochastics of the SPY and other indexes you can see that the indicator is opened up with a downside configuration. So this means that the odds are for the larger trend to be down. From a purely technical standpoint, I would not personally even consider a long trade until there is hourly time frame bullish divergence on the technicals while the weekly is down. Even better would be for the daily MACD to end up oversold with divergence.
From a multiple time frame stochastics analysis on the weekly chart of SPY, the fast line is just getting to the oversold area. So we could be alert for this week or next for a daily time frame stochastics divergence to develop while the weekly is near oversold. We are not there yet since the daily is at a new low in the stochastics for this correction. So again, waiting for bullish divergence to develop would be advisable here before considering long.
As another guide for the trader here, read this link showing what the last 2 bear markets were like in terms of price and time duration of legs down in a bear market. The typical bull market correction is about 1-3 months and averages about 10-11% decline. A bear market leg down is on average larger and longer than that. So what you want to do is to track the developing price action (and sentiment of course) and constantly compare......"does this look more like a bull market correction, or a bear market decline?"
In my opinion the SET-UP looks complete for a bull market top to be in place, with broad spread weekly time frame divergences, etc. However, it is early to make comparisons beyond that.
Friday, October 10, 2014
Expanding Pattern Off the Highs Suggests a Further Sharp Stock Decline Coming The Next 1-2 Weeks

Click Chart to Enlarge
This chart is a daily chart of SPY, the S&P 500 tracking ETF. What I am showing here is that the decline thus far off the high appears to be occurring with an expanding bias and we have seen increasing volatility. Based upon this, if the next move down continues in expanding fashion, and is 1.272-1.618 times the size of what I have labeled as the "c?" move, then that would project down to the little rectangle box around 185-187 on SPY. Based upon the time of the recent smaller movements in the pattern, I think it would take in the 4-10 day range for that to occur.
This would fit with the idea of the Russell 2000 completing a double top formation and breaking support and dropping sharply as I discussed a couple times over the last week or so.
Now at this point we are obviously seeing some extreme selling and should be alert for a bottom reversal process. Yesterday the VIX/VXV ratio closed above 1.0 for the first time during this decline. This occurrence has preceded the significant market lows over the past few years, often preceding the low by a day or 2. So while I believe both the SPY and the IWM chart patterns have significant bearish implication and could break the character of the recent corrections, I am alert here for more bottom attempts and will do my best to post here in timely fashion when prices do show high quality bottom reversal attempts.
As a side note, if SPY moves below 190.55 by Oct 31st, then it would retrace the last leg up from Aug-Sept, in less time than it took to form, and this would indicate a likely larger shift in market psychology to the downside.
So as the market develops here, especially if volatility continues to expand, if you have any questions on analysis or trade planning, feel free to start a comment dialogue below and I will try to assist you. I feel that in high volatility times where rebounds can be very sharp, it is wise to exit short positions on breaks of prior key chart support that may lead to rebounds. Also, as corrections hit new lows with underlying bullish divergence, my trading experience is that exiting portions of the trade into that type of price weakness will often produce the most favorable exit price.
The specifics obviously need to be planned well, but in terms of the general approach, that is what I would suggest in theory here.
Thursday, October 9, 2014
Beware of Another New Low For This Correction
Interestingly as my last post had mentioned, if we saw a new low for the correction and another buy signal, followed by yet another new low and high VIX spike, I think it would bode poorly for stock prices moving forward.
At this point we did see an initial new low followed by a major reversal higher and a follow through type day yesterday. Now here we are with immediate reversal in prices back towards the lows of the recent correction. So, again I suggest here that continued "nudges" lower will likely be indications that force is gathering behind a crack in the dam. And it could break and lead to flood of selling. Specifically refer back to my last post on the Russell 2000 support level and double top projection.
I again suggest that a short on a break of yesterday's low with a stop above the intervening high could be a profitable play with significant downside expectation.
Pete
Sunday, October 5, 2014
Buy Signal In SPY 10-3-14
Everything currently looks just like the significant corrective bottoms in stocks over the last couple years. The gap up and advance after a buy signal from my bottom spotting algorithm seems like a good start to another move up to new highs for the bull market.
I have discussed the longer term technical set-up as showing multiple time frame bearish divergence and warned that we may be at the end of this bull market. This current action doesn't really negate that outlook on a longer term status, but it does seem more likely that this current rally could make a new high, at least in some of the major stock averages.
Until the character of corrections (larger size, faster rate of decline, greater time duration) in this bull market, change, I don't feel there is great CONFIRMING evidence that a top has complete. A failure of last week's low to hold would be a significant sign in my mind for a possible change in character.
Currently, I would suggest that the appropriate strategy for index trading here is to be long currently, but with a stop below last week's low, and to establish short at a close below last week's low for those who look to catch the major downswings as well.

As has occurred so frequently over the last 2 years at the significant buying opportunities in the indexes, we have seen a typical expansion in the VIX relative to the longer term bollinger bands, now followed by a sharp move back into the bands. In my opinion from this analytical standpoint another move in the VIX above the current spike would not fit the typical relation of the recent corrections and associated VIX activity. So again, from a little different angle, last week's low appears important. And looking out further than that, if there were another spike in the VIX and new buy signal, if it were followed yet again by another higher breakout in the VIX, I believe it could lead to a sharp breakdown in stocks an spike in the VIX. That is looking out kind of far, but is preparing for contingencies in market action.
One relationship that has occurred at most corrective bottoms in the last couple years is a VIX:VXV ratio closing above 1.0 during the correction. This did not occur this time around - but that is the only potentially significant disimilarity that I see at this point.
Other measures of intermediate term extremes in selling all seem to have reached the levels that have corresponded to corrective lows over the lat 2 years. Total put/call ratio, McClellan oscillator, TRIN are notable examples.
I am basically discussing this here to build a case that given the current signals, IF the current bull market is to continue, THEN a corrective low is likely in place already. That would make any move to lower corrective lows a very notable occurrence, and likely warning of significantly larger price declines in store (in my opinion).
Pete
I have discussed the longer term technical set-up as showing multiple time frame bearish divergence and warned that we may be at the end of this bull market. This current action doesn't really negate that outlook on a longer term status, but it does seem more likely that this current rally could make a new high, at least in some of the major stock averages.
Until the character of corrections (larger size, faster rate of decline, greater time duration) in this bull market, change, I don't feel there is great CONFIRMING evidence that a top has complete. A failure of last week's low to hold would be a significant sign in my mind for a possible change in character.
Currently, I would suggest that the appropriate strategy for index trading here is to be long currently, but with a stop below last week's low, and to establish short at a close below last week's low for those who look to catch the major downswings as well.
Click on Chart to Enlarge
As has occurred so frequently over the last 2 years at the significant buying opportunities in the indexes, we have seen a typical expansion in the VIX relative to the longer term bollinger bands, now followed by a sharp move back into the bands. In my opinion from this analytical standpoint another move in the VIX above the current spike would not fit the typical relation of the recent corrections and associated VIX activity. So again, from a little different angle, last week's low appears important. And looking out further than that, if there were another spike in the VIX and new buy signal, if it were followed yet again by another higher breakout in the VIX, I believe it could lead to a sharp breakdown in stocks an spike in the VIX. That is looking out kind of far, but is preparing for contingencies in market action.
One relationship that has occurred at most corrective bottoms in the last couple years is a VIX:VXV ratio closing above 1.0 during the correction. This did not occur this time around - but that is the only potentially significant disimilarity that I see at this point.
Other measures of intermediate term extremes in selling all seem to have reached the levels that have corresponded to corrective lows over the lat 2 years. Total put/call ratio, McClellan oscillator, TRIN are notable examples.
I am basically discussing this here to build a case that given the current signals, IF the current bull market is to continue, THEN a corrective low is likely in place already. That would make any move to lower corrective lows a very notable occurrence, and likely warning of significantly larger price declines in store (in my opinion).
Pete
Thursday, October 2, 2014
Today's Bottom Reversal Attempt
Today stocks put in a bottom reversal attempt. All the key factors are in place based upon my algorithm, so this could be a legitimate time to make a trend continuation buy. However, the position would need protected with a sell stop below today's low.
This is a shorter term signal in that price is only at a 1 month low. And these have higher failure rates than similar longer term signals.
Now a subtle factor here is that the Russell 2000, IWM, did break below recent support as suggested. However, price reversed back to the upside, and it closed substantially higher, where the other indexes were flat. To me this illustrates the flush out of stops and then trade algorithms kicking into buy mode just below support, which occurred on the Russell but not on the other indexes. This being the case, it seems to be a hint that the buying is not broad spread legit market interest, rather it may be simply a reflection of the price/chart structure of the Russell 2000 index. So for now it looks good. However, I have seen this type of trade action before at key chart points. And what I would warn of is that a break of today's low would indicate that all the short term program buying was exhausted and that prices may then fall sharply. A notable comparison may be the August 2011 break of the June 2011 low.
So at this point it may make sense to be flat rather than short. Also, a move above today's high could be a typical buy signal. But a move below today's low could be reversed into a short or used to establish a new short if out of the market.
As a side note, the significant lows over the last year or so have occurred at the 126 day simple moving average. And today's reversal on SPY occurred there as well. So again, based upon that measure of trend, this would be a logical stopping point for this decline. And again at significant market turns, there will be a change of character. So, if prices decline below today's low with several percent follow through, that may reflect a larger scale market turn.
This is my take on things, anyway, and I will track the market more closely here for the blog as volatility is picking up.
Pete
Downside Projection Based on IWM (Russell 2000) Chart Pattern

Click on Image to Enlarge
This chart is a daily chart of the IWM etf which tracks the Russell 2000 small cap index. Of note here is a picture perfect double top so far where there was a false breakout and immediate selling. Now prices are at support where I have highlighted with green arrow a price level that has formed a very tight support level at about 108.00 on IWM. These are logical stop points based on price history on the chart. That being the case, there are two things that we can be quite sure of in my opinion.
- Prices will break below those levels in order to run the stops
- Given the magnitude of the pattern, there are likely enough stops and new short orders to create a follow through in price below the support level
How far will it follow through? Obviously only time will tell. But based on a typical double top chart projection, I have placed a projection line down from the support level showing a price projection to 95.50 if the double top completes and meets the equal projection from top to neck line, down from the neck line.
My personal bottom reversal algorithm registered a new extreme in downside panic yesterday. So at this point, we need to see a divergence in real money sentiment to develop concurrent with a price reversal bar in order to consider any long side trade from this point.
So to be clear here, there is currently a long side set-up on par with other high quality set-ups that have occurred in this bull market. So on that basis keep alert for long opportunities. However, given the multiple time frame large scale bearish divergences just completed, the double top in the Russell 2000, and other large scale optimistic extremes registered recently in the bull market, I expect that this correction could unfold differently and more ferociously to the downside. And bottom reversal signal that does occur certainly needs to be protected with a stop. I will update when those signals occur.
Sunday, September 28, 2014
US Stocks Have Possibly Topped for This Bull Market - At Least Expect Further Decline From These Levels
This post is just a brief update that my opinion is still that stocks are topping or have topped last week. The recent multiple time frame divergence was near picture perfect for a top, similar to the bond market top in 2012.
Price logic on the short term immediately off the top, showed a complete retracement of the the last little thrust up in less time than it took to from suggesting a counter trend move is developing with the possibility of a significant high having occurred.
On an intermediate term basis, the Russell 2000 has completely retraced its entire August-September rally in less time than it took to form, suggesting intermediate to long-term strength is down in that market.
The VIX/VXV ratio has not spiked above 1.0 yet on this decline, and that imbalance has market all of the recent significant lows over the last year plus, so I don't view a bottom as being in place on Friday's rally attempt.
Wednesday, September 3, 2014
Bearish Engulfing Pattern in QQQ Could Mark a Top

Click on Chart to Enlarge
Today both the QQQ and SPY formed bearish engulfing candlestick patterns. These are top reversal patterns, and should be considered significant if there is a technical overbought condition, a failed breakout on a chart, or a bearish divergence.
Currently, there is a triple time frame (weekly, daily, hourly, and even 15 min) bearish divergence on the MACD of the QQQ chart with other massive divergences in breadth, volatility, and put/call ratios.
So my current suggestion here is that you completely exit all index long positions on the US stock indexes. This has the technical and sentiment back drop for a potential major high, and we are entering the seasonally weak period of Sept/Oct, which should just be an additional factor for the trader to understand here in terms of market dynamics.
Short positions could be established on a break of today's low, with an initial profit target of 1:1 with a stop above today's high. So since this has the possibility for a big move down, you only exit 1/3 or 1/2 the position at the initial profit target. And another option is to just hold the whole position with a stop adjustment mechanism and allow the market to go however far it will until we get a legitimate bottom reversal signal. The pros to the first strategy is a higher win or breakeven rate, but a probably lower expectation given the quality of the set-up. The second scenario likely has a lower win rate but a higher overall profit expectation in my opinion.
Tuesday, August 26, 2014
Lowest Volume in SPY in Over 2 Years - More Topping Signs

Click on Chart to Enlarge
While it could be argued that we are in the summer doldrums and that is why volume is low, I don't know that it can rationalize the fact that SPY traded its lowest volume INCLUDING holiday trade, in over 2 years, except for Christmas Eve 2013. Very interesting. Seems like the market is just whispering...a couple very narrow range doji candlesticks right at new all time highs, and with the Dow 30 joining in today with another new all time high.
This does not seem to me a good sign for bullish market action going forward. Be warned here - in my opinion - that this market continues to display sign after sign of topping with divergences in every category of market analysis that I track - price, volume, put/call volume, volatility, breath.
This weekend's CoT report will be of interest in that both the S&P 500 and Dow 30 made new highs by today, and Friday's report will reflect data through today/Tuesday. That report has not flagged any major smart money selling here recently, so it will be interesting to see how they respond to the new highs. Of note though, as the lats bull market topped, the typical contrary nature of the CoT positions was not consistent, and so it would only be a possible confirming indicator to me of what is already obvious from my standpoint.....that stocks are likely very near to a significant high here.
PS - the chart above was posted shortly after close, and after volume numbers were finalized the reading changed. The chart above showed that volume was the lowest in over 2 years, but the final number is a bit higher than Christmas eve 2013.
Monday, August 25, 2014
Lowest Non Holiday NYSE Volume in a Couple Years
Interestingly today, the S&P 500 made a new all time high, hit the round number mark of 2000, and SPY opened with a gap up, and yet the NYSE volume dropped to the lowest level in over 2 years - excluding holiday trade. I'm sure that arguments can be made regarding what this means, but my opinion is that if buy programs are not kicking in here, then I kind of doubt that the market will hold up well at this level.

This chart shows a 3 year history of daily New Highs - New Lows on the NYSE. Of note here is that while we are at 2000 on the S&P 500 and new all time highs, the NH-NL is at a comparatively paltry 316. The closest precedent I see on this chart is the first couple days of May 2012, in which the S&P 500 did NOT make a new high, but some indexes did, and the NH-NL topped right about where it is now and then stocks corrected about 10% the next 5 weeks.
So possibly we see some continued advance and the Dow makes a new all time high, and the Russell 2000 pushes higher and we see this number expands. But currently, the reality is that stock averages are making higher highs with fewer stocks actually making higher highs. This is classic topping action as far as I can tell. Breadth deteriorates over a drawn out time frame, and finally the rally fizzles out. Time will tell here, but I would look at this current market point as a significant resistance level that currently does not appear will be surmounted in the short term.
Today also formed a narrow range doji candlestick on SPY. This could be an abandoned baby candlestick if stocks gap down tomorrow and move further to the downside. For now, there is a quality shorting set-up on the hourly time frame from my perspective.
Click on Chart to Enlarge
This chart shows a 3 year history of daily New Highs - New Lows on the NYSE. Of note here is that while we are at 2000 on the S&P 500 and new all time highs, the NH-NL is at a comparatively paltry 316. The closest precedent I see on this chart is the first couple days of May 2012, in which the S&P 500 did NOT make a new high, but some indexes did, and the NH-NL topped right about where it is now and then stocks corrected about 10% the next 5 weeks.
So possibly we see some continued advance and the Dow makes a new all time high, and the Russell 2000 pushes higher and we see this number expands. But currently, the reality is that stock averages are making higher highs with fewer stocks actually making higher highs. This is classic topping action as far as I can tell. Breadth deteriorates over a drawn out time frame, and finally the rally fizzles out. Time will tell here, but I would look at this current market point as a significant resistance level that currently does not appear will be surmounted in the short term.
Today also formed a narrow range doji candlestick on SPY. This could be an abandoned baby candlestick if stocks gap down tomorrow and move further to the downside. For now, there is a quality shorting set-up on the hourly time frame from my perspective.
Sunday, August 24, 2014
Stock Market Internal Sentiment Update


Click on Charts to Enlarge
A couple days ago I had posted similar charts to these showing that while price was moving higher the last couple days, we were not seeing internal market indicators continue the same trend.
Above we see SPY with a MACD below where the MACD has fallen a bit as price moved higher. There is nothing here that smacks of a significant reversal in my opinion, but it does look like a significant divergence is still forming on this time frame. Given the daily and weekly time frame MACD indicators are in a bearish divergence, this shorter time frame signal may be of significance.
The NYSE Tick indicator on the hourly chart has also weakened the last several sessions. A cross of the moving average below 0 could lead to some follow through to the downside. Again this indicator is still suggesting that any higher highs from here without expanding breadth could be a continued divergence building.
The VIX on the hourly time frame is still well above the summer lows, maintaining the larger scale volatility divergence that is so consistently present at significant market turns.
The bottom chart is a daily chart of the total put/call ratio with a moving average and some deviation bands. The current average is not below the lower band, but is close to it, suggesting that we keep alert for a move outside the lower band. That would be a higher quality signal that the rally was near peaking. Again of note here is that the moving average is well above its lows from the winter, but with prices now at new all time highs. So again this could be viewed as a large scale bearish divergence with fear (in the forms of put trading action) increasing and forming a rising trend while prices are mustering some modestly higher highs.
So in summary here, I think that the major bullish run off the recent low is mostly done and we are more likely to experience more overlapping price action from here and possibly a significant top reversal process here around the 2000 level on the S&P 500. It seems very likely to me that early this week price will move up to 2000 on the S&P 500.
Thursday, August 21, 2014
LB Puts


Click on Charts to Enlarge
Today I purchased a couple contracts of LB Sept 62.50 put options on LB, Limited Brands. Typically I like to purchase a longer amount of time, but on this trade I am looking at a potentially competed rising wedge in LB, in conjunction with a short term overbought general market with some hourly time frame divergences. I am setting a limit order of just over 100% gain to exit the trade, which may only take a 3-4% move down over the coming week.
I entered the trade in the afternoon for 0.95 per contract. I am setting a limit order of 2.00 to exit, GTC.
The charts above are weekly, daily, and hourly. The weekly stochastics is in the overbought position below the recent bull market high. The daily stochastics is in the overbought position. And the hourly momentum shows a bearish divergence between the current highs and the highs last week.
The chart pattern appears to be a rising wedge and contracting triangle. The current move has over thrown the upper boundary of the wedge, and from a charting standpoint, this is the type of action often seen at the end of a pattern.
It is interesting to note the key points in the pattern. In the current move up over the last month, the sales report came out and led to a gap up in the stock on 8-7-14. Then today, earnings was released, and there was very mild movement to the upside in conjunction with the hourly chart divergence. So it seems that the price driver to the upside has probably already occurred, and now the last weak move on earnings may be an exhaustion point.
Particularly with the broad market appearing to be on the verge of a consolidation or pullback for at least a few days, I believe this stock has the ability to decline back into the $60 region within the next few weeks.
This trade example is for learning purposes only. And being an out of the money option trade, if the trade does not go as planned, it will result in 100% loss of capital. So I have that factored into my trade size here. I only purchased a couple contracts, and can stand to lose the whole amount within my money management plan.
Hourly Time Frame Bearish Divergences on SPY - The Current Rally Appears to Be Losing Steam


Click on Charts to Enlarge
These charts are hourly charts, the top one being SPY with a MACD study underneath. We can see a nice directional advance the last 2 weeks, but now for the first time in the rally, the MACD is not confirming higher highs with price. So on this short term time frame we are seeing the initial stages of loss of momentum and a potential top development.
The second chart down shows an hourly chart of the NYSE TICK Index, which is a short term measure of breadth in the market. Again, we see here that the TICK peaked a couple days ago, and the last 2 days prices have been advancing with no increase in the TICK, and TICK currently at a lower peak. Again, this is a sign that the real directional phase of this rally is waning.
The third chart down is SPY again with a volume and moving average of volume overlay. Of note here is that the moving average of the volume is also rising to a lower peak and is showing divergence the last couple days. The interpretation is basically the same, but the thing I find most interesting is that yesterday and again today SPY is hitting fresh all time highs. And so if there is weakening volume on the breakout, then I question whether the trading algorithms are collectively going to buy the breakout to any substantial level if the first two days at new highs are not attracting larger volume and price movement.
The bottom chart is the VIX an an hourly basis. We do see the VIX hitting fresh lows today for the rally, but only modestly so, and in comparison to the VIX low in June and July, the VIX is at a higher level still having a longer term non-confirmation of the price trend at new highs.
So given what I have recently noted regarding the tendency in recent years for swift rebounds the first 2 weeks after a bottom with elevated equity put/call ratios above 1.0, all the above signs would indicate that we could be near the high of the initial rebound. I don't expect a sharp topping process here, but let's continue to track this 2000 level on SPX for signs of longer term topping or reversal.
Tuesday, August 19, 2014
How Far Is This Current Stock Market Rally Likely to Go?
In a recent post I highlighted the rise in the equity put/call ratio to above 1.0 and suggested that we would see at least slightly lower lows followed by an inevitable swift rally with most of the gains in the first 2 weeks of the rally.
Well here we are now and it appears that so far things are playing out very much as suggested/expected. Today will market the 8th day of the current rally off the 8-7-14 low. And it definitely has been a swift and directional advance. So now that we are in the time frame of where we may expect things to slow down or for a possible larger scale top to complete, let's look at some more details.....
This list shows all equity put/call readings greater than or equal to 1.0 since CBOE data available in 2003. I had suggested that the Aug 2007 and June 2011 instances were the most technically similar in recent years with overbought and divergence conditions on the weekly time frame already being in place.
If we replicated the rally from June 2011 low to the July 2011 high, it would put SPY at about 204.00 this week to next week. But again it may be more sensible to correct for volatility and to understand the tendency for final highs or secondary rallies to double top or fail to exceed an old top. From a simple chart based standpoint as opposed to measuring in percent terms, the rally off Aug 2007 lows made a slightly higher high for the bull market, basically double topping then declining. Off the June 2011 low, the rally was more brief and failed slightly below the prior high from May 2011.
So as we now see the QQQ at a new high, and the other indexes still lagging with concurrent divergences still present, I believe it is sensible to expect this move to stall near or slightly above the recent all time highs in SPY.
If prices decline below the recent low from Aug 7th, I think that would be a sign of broad market weakness. So that could be a line in the sand to watch depending on your holdings and time frame.
Sunday, August 17, 2014
Multiple Time Frame MACD Bearish Divergence on QQQ Suggesting a Possible Bull Market Top
Multiple Time Frame MACD Bearish Divergence on QQQ Suggesting a Possible Bull Market Top
I have published a new technical analysis video covering the Nasdaq, VXN, banking stocks, and housing stocks in depth. The trend channel and MACD technical analysis as well as broad scale index and sector non-confirmations suggest to me that a major top is indeed in process here in stocks. That is my opinion anyway from an analysis standpoint. As always, translating analysis into objective trading is another level, so simply use this info within an objective trading context.
Futures this evening are up, and it will be interesting to see this week whether there is a weekly top reversal candlestick in QQQ. A gap up tomorrow/Monday followed by a significantly lower close on the week, would fit with the typical topping price patterns seen in markets. If prices on QQQ this week close below last week's open @ 95.27 after a gap up tomorrow, that would be a weekly bearish engulfing pattern, and that would be a significant price bar given the technical analysis in my opinion.
97.94-98.35 would be the typical topping price range for QQQ given the hourly chart technical analysis in my opinion. I personally have an order to purchase deep OTM puts on the SPY etf to take advantage of a possible top and sharp decline into the seasonally weak period of Sept-Oct in stocks.
Thursday, August 14, 2014
DBA Call Option and Technical Analysis

Click on Chart to Enlarge
This is an hourly chart of DBA, which is the PowerShares Agriculture fund. I purchased some call options near the close of today's session. I bought the Sept 26 calls for 0.50 a contract. The spread was about 0.05 which is 10%, but given the possibility of a 100% + move in the options over the near term I settled for it.
The chart above shows a beautiful bullish divergence on the momentum as it hit today's lows. But I would suggest looking at the multiple time frame set-up as well. The daily MACD and momentum are showing classic bullish divergence as well between the two major lows visible on the chart above. Additionally, the weekly stochastics is over sold and with some mild bullish divergence. So it appear that today could be the trough of a potential multi time frame turn higher.
Looking at the last portion down of the chart above I have labeled a nice looking Elliott wave style 5 wave impulse. So at this point given the obvious loss of momentum and the possible failed break below the July 11th low, it appears likely that we see at least a partial retracement of the last move down over the last couple weeks. From looking at the daily chart, it seems that a move back up to the 27.00 level could be quite likely.
If prices do indeed rally here, and completely retrace the last two weeks downward move in LESS time than the decline took to form, I believe the logic would be that a new upward pattern was at play, and that we could probably expect prices to rally well above 27.00 in coming weeks. The pink vertical lines show the current forward time projection as August 29th the date prices would need to move above 27.00 by in order to confirm this.
So given that possibility I just bought the Sept expiration calls anticipating a quick rally to 27.00, with possibly a move well above that.
My current exit plan is to simply maintain the option with no stop loss and am willing to hold until expiration even if it results in 100% loss. That is factored into the amount risked/put into the trade. I currently plan to exit half the contracts at 100% gain if prices rally modestly from here. HOWEVER, if prices rally very swiftly (3-4 days) back above 27.00, then I will opt for holding all the contracts and use the daily chart as a possible exit indicator prior to expiration if a divergence develops.
So part of the logic is that a rapid retracement of this last decline would suggest a likely new pattern occurring, and with the 26 strike option, it would seems likely that the option would expire in the money and that the 26 level would be a significant support level. And so I would like the opportunity to make a larger gain on the whole position if everything develops in ideal fashion.

Click on Chart to Enlarge
This chart is a daily chart with two projections up from this low that simply project the 2 prior significant rallies visible the chart up from today's low. In both instances we see it would be likely that the option could expire in the money and probably make 100% gain along the way. But if we see a significant rally even close to the green projection line, then a 400-500% gain on the option would be possible. So while I don't EXPECT that, I want to plan for the scenario that makes the big money and maximize it by holding the whole position if price explode up from current levels indicating a possible intermediate low is in place.
Pete
FL Dual Time Frame Put Option Set-Up

Click on Chart to Enlarge
This is a daily chart of FL, Foot Locker. Notice the daily stochastics in the overbought position at a lower high and the more time consuming and overlapping rally off the 7-17-14 low, in comparison to the prior decline off the high. This creates a nice price logic set-up for a short sale or put option trade. Now let's move down to an hourly chart to focus in on a trade entry for the set-up

Click on Chart to Enlarge
This hourly chart shows a recent momentum peak at the upper end of the recent range of the momentum indicator. Now we are seeing price to push to higher highs, but the momentum indicator is reaching a lower peak. The indicates a slowing down of the current action, with the distinct possibility the price will soon reverse to the downside. So from this point, on a trading basis, an objective method is needed to enter, or simply enter during the divergence and place a stop above the resistance level which would be the highest point on the chart.
HOWEVER, the earnings release is next week, and so the potential exists for a significant gap or price movement. So in this situation my reasoning is that making a trade just before earnings is essentially a gamble, and if the earnings moves the stock up rather than down as the technical analysis suggests to me here, then I basically have a coin flip in risk versus reward by shorting the stock.
But in terms of options, if price moves up and no significant decline materializes, the max loss is 100% of the option value, but if earnings comes out with a gap down and break of the recent July support, the option could very reasonably move 200-300% or even more over the next couple weeks. So in this situation I am electing to try to purchase a put option as prices hit this resistance area, with the reasonable probability of a 3:1 reward versus risk on a Sept 50 put option.
I currently have an order to buy the put at a limit of 1.40. The spread is about 0.20 on the option, and it appears that price would have to move another 20-30 cents up before the order would fill.
Please note that this is for education, and that you will lose 100% of the money in this trade if the trade is not successful.
Subscribe to:
Comments (Atom)