I have recorded a new video this weekend updating members of my mailing list on the current market position. I also have begun a stock selection service based on my Integrative Harmonic Trading methodology. And I am opening a discounted enrollment period for that service through the first week of January. I will do that from time to time dependent upon market conditions. In the current case, I think the service will provide outstanding value to subscribers over the near term.
The methodology integrates general market timing and analysis (some of which I frequently detail in this blog) along with what I believe is that best harmonic pattern identification method available. But because the timing of low risk and high reward trade entries will be dependent on market turning points to a large extent, there may be periods of weeks or months were the most ideal opportunities have passed or are yet well ahead of us.
So if I was a new subscriber to a service, I would want some good opportunities right off the bat. And that is what I intend to achieve with opening discounted enrollment periods at times when I expect the market conditions to be offering an abundance of good opportunities.
If you would like to receive future notice of discounted enrollment periods and occasional additional market updates, then you can put your name and email in the form on the right side of this page.
With that I wish you all a safe and happy New Year! It's always an exciting and hopeful time (I think anyway).
I will be traveling for a couple weeks and video updates may be sparse, but I will still post charts and analysis as appropriate.
All the best,
Pete
Monday, December 31, 2012
Monday, December 24, 2012
Early 2013 Stock Market Forecast

Click on Chart to Enlarge
Near Term 2013 Stock Market Forecast
The chart above is XLB which is the materials sector ETF. I have chosen to use this chart rather than one of the major market averages because the pattern looks more clear and looks similar to the summer of 2011 topping pattern, so I may draw an analogy to a price pattern that I forecast at that time.
The shorter term price action and technical analysis suggests that there may be another push to at least slight new highs for this rally off the November low. That could create an ideal bearish divergence on the daily time frame. Given the relatively consistent seasonal tendency for price gains around Christmas to New Year's, that would seem likely. Also it would be common for the end of C to push above the dashed parallel channel line on the chart between A and C.
Now most pattern analysis is very subjective, but imposing logical rules upon the pattern and post pattern price action can bring pattern analysis toward a useful/objective form of analysis.
In this case of the current flat pattern there are specific requirements of price action to confirm that the pattern I am suggesting actually did/is taking place.
- The first requirement after a possible high completes will be for the wave C trendline to be broken in less time than wave "v" of C took to form. (not yet clearly identifiable on chart)
- Then the entire wave C move must be retraced in less time than it took to form. So this would suggest prices below the November low in roughly 2 months after the expected high.
- Then for further confirmation, the X-B trendline (in dashed blue) should be broken in less time than wave C took to form. Since that trendline is downsloping, it implies considerable weakness ahead at this point.
So while I don't know whether this is occurring, the pattern is reasonable and the expected move will be extremely large and fast. I would strongly suggest any long trading positions have a moderate to tight GTC stop in place at this point.
If this pattern plays out as suggested, February or March 2013 put options could stand to make considerable profit. Ideally a put purchase could be made on an hourly chart MACD cross to the downside after prices potentially push to a new rally high over the next several days.
The obvious support under the market is in the area of the June 2012 and Nov 2011 lows. I would anticipate price moving to that region before attempting a rally. However, a typical leg down in a bear market, if that is what is to come, is on the order of 4-5 months before a 1 month low to high correction. So on that account, we may be set for much lower prices into roughly June of 2013 before a major rally attempt.
This following posts are taken from the final move up in 2011 as a very similar pattern completed and in July 2011 I forecast a large move down in stocks based on the pattern. You can read those for further understanding of the current pattern possibilities. In the current pattern, the break of the Sept 2012 low is analogous to the break of the April 2011 low in those posts. It implies that it is unlikely for price to make a new high above the Sept 2012 high, but will likely come close.
http://stockmarketalchemy.blogspot.com/2011/04/possible-pattern-completion.html
http://stockmarketalchemy.blogspot.com/2011/05/spy-short-term-oversold-at-gap-support.html
http://stockmarketalchemy.blogspot.com/2011/07/possible-completion-of-flat-pattern.html
Additionally I will refer back to a recent long term outlook post I made. It appears as though the second scenario in that general outlook is coming into play.
Some outstanding short selling opportunities are setting up and nearly ready to trigger at this point in a number of individual stocks. I have made a new free video update available to members on my mailing list detailing some of those. You can access that by clicking on the link in this paragraph or by filling out the form on the right side of this page.
2013 Stock Market Forecast Video
This video covers further technical analysis details and set-ups to watch for over the coming days or weeks as well as "smart money" analysis of the CoT report.
Technical Analysis and CoT Review
Sunday, December 23, 2012
How to Use Fibonacci Retracements in Harmonic Trading
How to Use Fibonacci Retracements in Harmonic Trading
I have recently created an intensive and integrative trading course detailing my personally developed and researched harmonic trading method for trading individual stocks. The course content is much different than the content on this blog. If you want to learn a way to trade stocks for big gains that can be used for trading or investment purposes in every market cycle, then please consider taking this course. I promise it's great stuff and I give you a 100% satisfaction guarantee or your money back. It can be used on any time frame, but is most applicable to a daily or weekly time frame in order to integrate all the principles together as shown for maximum winning percentage and profit potential.
I'll have a new time sensitive video going out this week special for members on that list.
If you would like more information on some basics of the method to use right away in your trading, then fill out the form to the right of this page and follow through with the links or click on this link to my stock market forecasting mini course and fill out the form there.
The video above gives a brief introduction on how to look at Fibonacci retracements in context of harmonic trading patterns.
Fibonacci Retracement Video Highlights
Fibonacci retracements can be used in conjunction with harmonic pattern identification in order to predict in advance the most likely price reversal zone for a stock.
I use extensive fibonacci inter-relations in my harmonic trading course in order to create one of several "layers" of probability backing my trade.
This video shows a basic three retracement approach applied to ABC patterns that are smaller than a prior move up. Overlapping of the Fibonacci retracements in a small price region suggest harmonic proportion in the price chart, and this is the type of relationship you want to see in harmonic trading candidates.
This video shows a basic three retracement approach applied to ABC patterns that are smaller than a prior move up. Overlapping of the Fibonacci retracements in a small price region suggest harmonic proportion in the price chart, and this is the type of relationship you want to see in harmonic trading candidates.
Watch the video, and hopefully it will help you in your trading.
-Pete
-Pete
Wednesday, December 19, 2012
Stochastics Bearish Divergence
Stochastics Bearish Divergence on the Stock Indexes Daily Time Frame

Click on Chart to Enlarge
The chart above is DIA which is the Dow 30 ETF. It formed a bearish engulfing pattern today which is a bearish top reversal candlestick. The reversal took place at a 78.6% fibonacci retracement of the move down since September, and there is a classic bearish divergence on the stochastics study under the chart.
Based on the multiple time frame momentum set-up and the price pattern, I am expecting a high to occur soon. So this could possibly be a very significant high. The ideal time frame for a high is not until next week from my perspective, but that could be a little anal retentive.
If the stochastics or MACD turns into a sell signal soon, it could be a very profitable signal from my perspective.
I will update in detail in an upcoming post.
Thursday, December 13, 2012
Pullback Expected - Unfilled Gaps are the Short Term Target

Click on Chart to Enlarge
This chart is IWM. It formed a bearish engulfing pattern yesterday with the daily RSI near 70 and right at the large gap down level from mid October. Notice that the stochastic study has a mild bearish divergence and is now opening up into a sell signal. If yesterday's low is broken that will trigger a trailing 1 bar low sell signal.
Given the larger context here, I think that could offer a nice very short-term trade. The blue arrows on the chart represent unfilled gap downs that are likely to attract prices on pullbacks. I think there is a high probability that the closest unfilled gap down gets filled pretty quickly if yesterday's low is broken. Then if the market closes below that gap level, it will likely move down to fill the next unfilled gap up as well before possibly moving higher.
If you watched my video yesterday, then you should know that we are approaching a potential upward pattern completion point. Because of that, I would suggest to be more inclined to take short trades on appropriate signals rather than longs, even though the traditional Santa Clause rally is due.
In 2007-2008 the market experienced a muted rally until around Christmas, but as soon as the holiday trade was done, the selling became aggressive. So basically if we don't see a good Santa Clause rally, that may be indication of implied future market weakness in that the most consistently seasonally strong period couldn't rally the market much.
Wednesday, December 12, 2012
Stock Market Update 12-12-12
Stock Market Update 12-12-12
This video provides a stock market update covering US markets and ETF's as well as foreign market ETF's. The current upward pattern may have a completion and topping time frame around the Christmas holiday. Several sectors of the US stock market and world market ETF's are pushing to new highs since the Oct 2011 low, though some are lagging well behind and may be ideal candidates for short opportunities in coming weeks.
Tuesday, December 4, 2012
Bearish Engulfing Pattern

Click on Chart to Enlarge
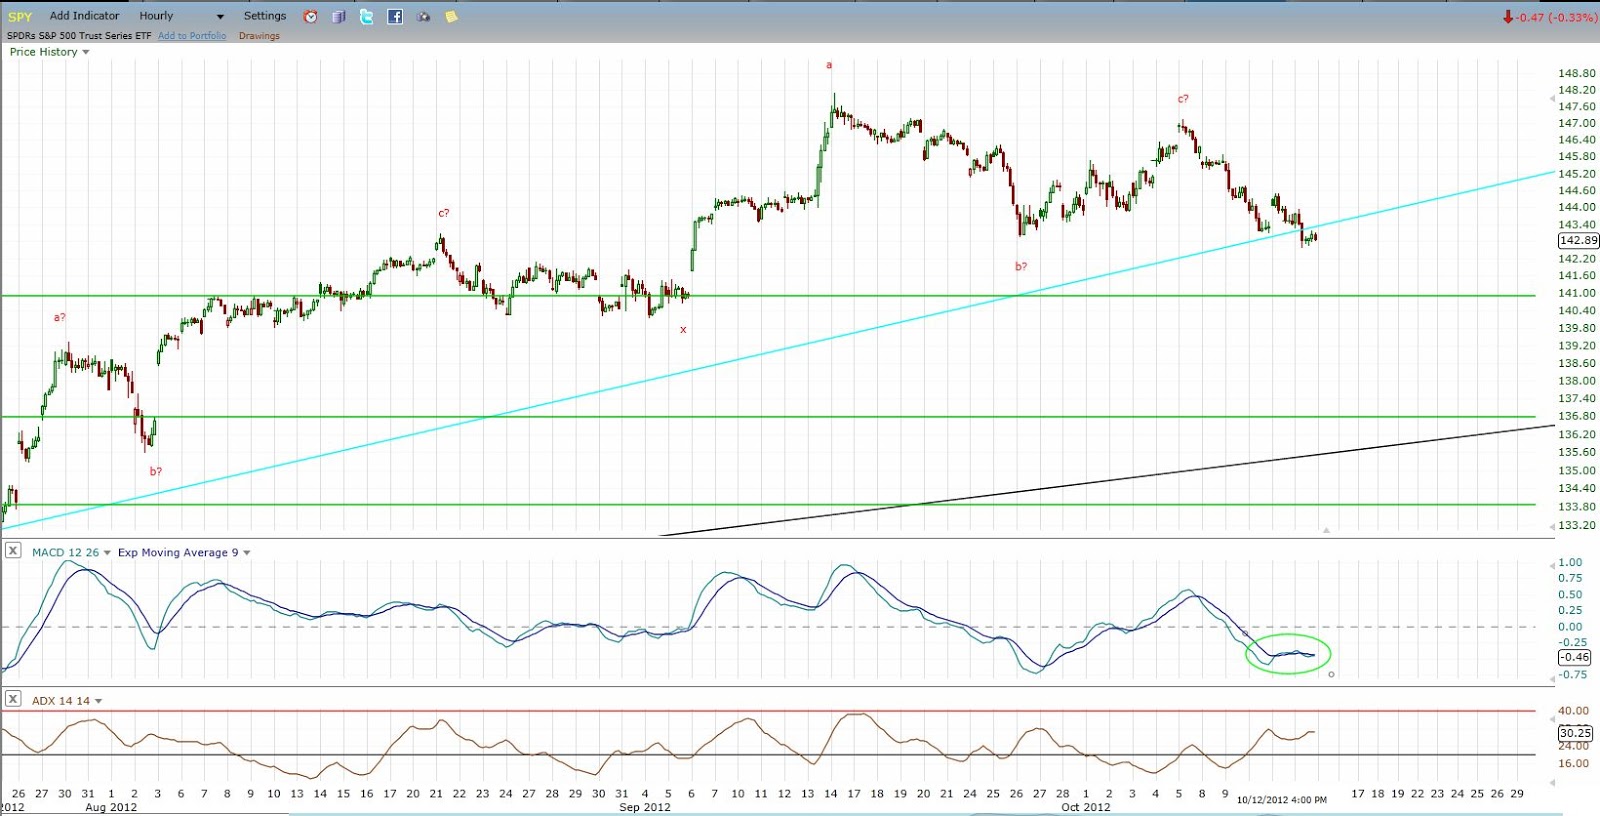
The SPY etf formed a bearish engulfing pattern Monday after filling the post election gap down and touching the 50 day moving average. This may be program selling and initial profit taking on this move up, but suggests a multi day pullback should be expected. Given the lower volume on the day, it may be weak program selling, and a push to new highs above Monday's highs, would like lead to some follow through to the upside.
In the larger context this could be the peak of a somewhat typical backtest of the broken Oct 2011-June 2012 trend line. From my research and data on harmonic trading pattern analysis, the most common candlestick pattern that shows up on backtests of broken trendlines after completed successful bearish harmonic patterns, is a bearish engulfing pattern. Again, the back test often peaks in the region where the trendline break took place on the chart, or at a fill of a gap down that broke the trendline. Both are applicable here as well, though this pattern in the market averages is not the type of pattern my research specifically quantifies.
Additionally this bearish engulfing pattern is occurring as the RSI has approached 60 which is often the rough upper boundary for RSI in a downtrend.
On the weekly time frame the set-up has developed nicely for a dual time frame indicator short sale set-up. The weekly MACD on the indexes is still in a sell configuration and this little rally has given the opportunity for a bearish cross on the daily MACD to possibly continue a primary downtrend. The indicator set-up will be one to follow the next couple weeks.
You can learn more about the bearish engulfing pattern at this link.
Friday, November 30, 2012
Bearish Divergence Suggests A Pullback Soon

Click on Chart to Enlarge
The hourly MACD is now overbought with sharp bearish divergence suggesting that the market is likely to experience somewhat of a pullback, though the odds look favorable for at least some continuation of the rally afterwards.
Given the large gap down from the day after the election is not yet filled, it may be ideal for the market to push somewhat higher today to fill that gap before experiencing a multi day correction. Then I think it would be ideal for a pullback to below Wednesday's low before a possible further move upwards.
Tuesday, November 27, 2012
Stock Market Analysis Video
This video covers stock market analysis on multiple time frames. The hourly charts are overbought but without strong bearish divergence which suggests that price action may become choppy before a multi day pullback occurs.
Brief notes on trendlines, moving averages, unfilled gaps, and several technical indicators are covered.
Monday, November 26, 2012
Monday, November 19, 2012
AAPL Chart Analysis - Probable Rebound Attempt Coming

Click on Chart to Enlarge
As I have detailed repeatedly in recent posts, the initial target for AAPL on this move down off the fall high was the low of the previous base around the $525 level. On Friday we saw a big swoon below that level on high volume followed by a reversal to close above the old base low.
The candlestick was a very high volume and wide ranging hammer type candlestick. It is not uncommon for an immediate reversal higher after a break of a major low like that. Understand what is going on in the market at that point......Obviously many standing sell stop orders would be placed below that low based on chart support for the major uptrend. So the market will typically push through those points where many orders accumulate to "wash out" the stops before reversing. And obviously there will be some smart money placing orders to buy just under or at where those last ditch stop orders were placed.
So the bulls took control and pushed the stock higher. Given that the markets are oversold on the daily chart time frame, I think we may see a multi day rally attempt from this point in the general market averages.
But in the case of AAPL, if the stock does rally from here but later fails and breaks to new lows, that would be a major failure for the stock and may lead to a continuation down. On a short-term note, those wide range hammer candlesticks have about a 60% probability of future prices moving BELOW the mid point of the tail on the hammer even if the reversal holds. Given the possibility of a significant rebound attempt in the stock, a set up like that can be followed intraday as prices move back into the tail region and then any upside reversal signals can be taken as long trades and often create an outstanding reward/risk opportunity.
When stocks that are heavily owed by institutions (as AAPL obviously is) top out, they can lead to some sloppy price action and volatile, choppy price moves as the topping process unfolds.
The general markets are not yet showing the typical bullish divergence on a daily frame that is typical of most corrective bottoms. So I think we may be in store for a rally attempt for several days, followed by new corrective lows before a possible more sustained advance or rally attempt.
If you would like to learn more about the market forecasting techniques that I use to consistently pinpoint market turns and trend changes, then fill out the form on the right side of the page to receive my free stock trading video course, or click on the link above.
Friday, November 16, 2012
Stock Market Analysis 11-16-12
This brief video covers RSI, MACD, ADX indicators and what to expect over the near term.
Wednesday, November 14, 2012
Bond Market Update - TLT ETF
Monitoring for a tradable topping pattern and technical set-up. Likely at least a little more upside in store.
Tuesday, November 13, 2012
Saturday, November 10, 2012
Stock Market Video Update
Check out this video update for short to intermediate term technical and sentiment analysis on the stock market.
Friday, November 9, 2012
Short-Term Oversold, But No Divergence

Click on Chart to Enlarge
The hourly chart of SPY is oversold and the MACD making a bullish cross as I type this. The daily chart shows prices have been touching the lower bollinger band for a few days indicating that prices are stretched to the downside. However, there is no bullish divergence on the MACD even at the 30 min time frame, which calls into question whether this move down is bottoming for a major rebound attempt.
The chart above is the VIX/VXV which is shorter term volatility divided by longer term volatility. In general the shorter term (VIX) should be lower creating a VIX/VXV ratio that is less than 1.0 (indicated by the green line). However, there are times when the VIX gets higher than VXV. That usually indicates a point of intermediate term panic in the market and leads to a rebound pretty soon. The market is out of balance under that condition.
Currently the ratio is not quite at 1.0 yet. I have been watching this indicator to help pinpoint an upcoming rally attempt. Of note is that the ratio is higher than it was at the June 2012 low which did not even reach 1.0.
If it does move above the 1.0 level, I would expect a tradable bottom to occur soon after. There is no guarantee that it will reach that level before a major rally attempt, and with prices oversold on the daily time frame, I think this is a time to protect open short positions by tightening stops or exiting on appropriate technical signals.
Saturday, November 3, 2012
Stock Market in Potentially Explosive Position

Click on Chart to Enlarge
See the chart for notes. The Dow (and other indexes) is in a potentially explosive downside position. Using a "stop" order to short on a break below last week's low may be the best strategy in this case. A stop would be placed above the highs of the rebound off of last week's low.
Of note, but not shown here, there has been a dearth of "smart money" buying occurring over the last week or two compared to the buying that occurred at the June low. So with the market at obvious trendline/chart pattern support, the smart money is not buying aggressively. This is suggestive to me that a downside continuation will occur, and probably sooner rather than later. The next obvious chart support is the June low if a sharp breakdown does occur.

Click on Chart to Enlarge
If the SPY is at a new corrective low by Tuesday afternoon, that keeps the shorter-term price logic clearly down. So again, entering short (if triggered by Tuesday) on a stop below last week's lows would be my preferred strategy.
The hourly MACD crossed into a sell Friday afternoon. Since the Sept high, these signals have been good indications of renewed selling and have not developed divergence prior to price move to new lows. That is typical behavior of a trending type move. So again, a quick move to new lows would be further indication of a predominant downward price psychology.
While the markets may seem oversold, it is important to consider multiple time frames. While the daily time frame reading are nearing typical oversold readings, intermediate sentiment readings are not yet at a point that screams of an imminent rebound. And weekly, monthly, and quarterly indicators all are overbought and turning down. The weekly stochastics and MACD indicators are not oversold at this point. In fact the weekly MACD has just crosssed down after a bearish divergence, which is typical indication of a larger degree trend change and impending sizable move. So understand that there is plenty of room to the downside here for prices.
Thursday, November 1, 2012
Probable Further Rally

Click on Chart to Enlarge
As discussed in recent posts, the markets were short-term oversold and looking ready for a rebound. It looks like that has started today. Based on the recent "waves" up and down I have projected a topping zone for this rally onto the chart with a red box.
I believe this rally is likely to be larger than the green line projected up from the recent low.
We can see that the MACD is just under the zero line and rising. So it still has several days before a typical overbought signal could occur on this indicator. I think it will probably be late next week before a possible great short opportunity presents itself.
Seasonally, the first week of November has a bullish bias historically so that may be a tailwind here into the election time frame.
Based on the continuing pattern here, I think that the final upward move since the June 2012 low may be occurring now. The downward price moves since the Sept high have not been dramatic enough to suggest the psychology has turned clearly bearish yet.
But after this rally, based on my interpretation of the pattern, I think both a shorter and longer term pattern could be complete, which would imply a huge downside reaction coming. Maybe the markets will sell off in response to the election results?? Certainly the time frame would match in my opinion.
In any case, from a trading standpoint, my suggestion is to look to be a seller as this short-term rally matures. Watch the hourly charts, and hopefully the MACD develops a classic divergence to tip off a nice short entry. If considering the long side, the recent action has clearly been a series of lower lows on the hourly chart. So I think it wise to wait for a rally then a pullback to a higher low, followed by a technical "buy" signal if considering the long side.
Friday, October 26, 2012
Dow 30 Trendline Break
Dow 30 Trendline Break

Click on Chart to Enlarge
The Dow 30 has broken its Oct 2011-June 2012 uptrendline and held below it for 3 days. This is early confirmation of a completed rising wedge TOP chart pattern. The daily MACD lines are just crossing below 0 after a bearish divergence suggesting that the MACD could get significantly more oversold before it would be screaming for a rebound in prices.
Often after a wedge trendline breaks, price will back test the line. So we may get a little more downside followed by a sharp rebound to test the broken trend line.
The S&P 500 is just hovering at its trendline today. Over the intermediate term it still appears to me that more downside is in store, but be prepared for a possible rebound that may offer an outstanding short-selling opportunity.
Wednesday, October 24, 2012
Market Update Video
Stock Market Update 10-24-12
Check the video out for the current market position and trade set-ups!
Tuesday, October 23, 2012
Mild Panic Alert!

Click On Chart To Enlarge
While I am not going to go into any details on this indicator right now it is a "real money" indication that I've constructed to measure the amount of fear or panic taking place in the market. Currently it is showing similar fear levels to 4-9-12, 3-6-12, and 8-1-12. Those all led to rebounds in the market.
But you can see from the chart that it is possible for panic to move up quite a bit to reach even the levels in mid May of this year.
Any bullish reversal bar at this point should be respected for an upside rebound, but it is a situation like I have mentioned before, where we are probably pretty close in time to a significant low, but we may see some rapid price changes in a few days before the low occurs.
Given the pattern at play in the market right now, I've mentioned that we may see a rapid move back below the June 2012 lows. So unless we see a real nice set-up develop on the long side here, I would play this by tightening stops on short positions, and then using any rebound as a possible re-shorting opportunity.

Friday, October 19, 2012
Death Knell for Bull Market??

Click Chart to Enlarge
This chart shows the green support line of the cup w/ handle breakout on AAPL clearly violated today and on heavy volume. As I mentioned before, this set-up has the potential to quickly take AAPL back to the $525 level which is the low of the recent base. It would not be unreasonable for that to happen next week, since earnings is AMC on Thursday.

Click on Chart to Enlarge
Notice the strong bearish divergence on the weekly MACD, which has already crossed into a sell signal. At the last 2 bull market highs in AAPL we never even saw a divergence like this. So it will be interesting to see what happens. But a weekly major divergence after a 4 year price rise is suggestive of more than a minor correction set to occur here.
While the market may feel oversold here, and the daily RSI is not far off from oversold, both the weekly and monthly currents are overbought, divergent, and turning down. So the market may have substantial price losses before a sustained rally here. Also, at just 1 month, this correction is still even young for a bull market correction. If it is the first move down in a bear market, they usually last for a few months, so we may expect a good ways to go.
Also, I have talked about the fact that after a pattern completes, the market will confirm it by completely wiping out the most recent move in LESS time than it took to form. So that means that if we are completing a major high, then we will see the market back below the June low by December.
If short, my suggestion is to stay short. Don't be long the market right now IMHO.
AAPL Alert!
Just a quick heads up here that AAPL has broken its recent support and appears set to make a weekly close today BELOW the $620 cup with handle breakout point I've mentioned. Given the massive weekly MACD bearish divergence and earnings next week on AAPL, I think this is a good signal to apply to the general market as a GET OUT OF LONGS signal.
Daily uptrend lines since June are being broken today also in the S&P and Nasdaq Given the fact that we had a brief rally just prior to the break, that probably tilts the odds in favor of continuation after the break rather than a rally to test the underside of the trend line. But that remains to be seen.
Daily uptrend lines since June are being broken today also in the S&P and Nasdaq Given the fact that we had a brief rally just prior to the break, that probably tilts the odds in favor of continuation after the break rather than a rally to test the underside of the trend line. But that remains to be seen.
Thursday, October 18, 2012
Short-Term Overbought - Nice Short Trade Set-Up

Click on Chart to Enlarge
The MACD may need to make some bearish divergence before price turns down, but a trade opportunity is probably close at hand.
Sunday, October 14, 2012
LONG TERM MARKET OUTLOOK UPDATE - Larger Currents Turning Down, But Short-Term Oversold

Click on Chart to Enlarge
The monthly stochastics on the SPY is now in a bearish divergence in overbought territory suggesting a possible major high completing. In addition to the weekly MACD bearish divergence, the stage is certainly set for a possible major correction of the bull market, or an outright bear market. IF a bear market is beginning, then there are two distinct possibilities for future price action to logically CONFIRM that is the case.
1. The first would be for the entire move up since the June 2012 low to be completely retraced in less time than it took to form.
2. The second would be for a decline, then a rally to a lower high, followed by a move that completely retraces THAT rally in less time than it took to form.

The weekly stochastics on SPY is now pointing down from overbought and has triggered a 1 bar trailing low sell signal on the weekly time frame. See the recent video for further detail on that set-up. This again suggests that we may see several more weeks of downside before the selling pressure is overdone.
Click on Chart to Enlarge
The hourly MACD chart is oversold with mild BULLish divergence at this point suggesting a short-term (multi-day) rally may be likely. HOWEVER, with the larger currents turning down, my guess is that the rally may be dampened, and be more of a sideways chop or consolidation for a few days before a break to lower corrective lows. Also, apparent on the hourly chart is logical confirmation of a downward pattern beginning because the recent rally was completely retraced in less time than it took to form. It will take a move basically to new highs in 5-6 days to shift the price logic back to upwards on the daily time frame.

Click on Chart to Enlarge
A 7 legged pattern may be completing to finalize this bull market. CoT major sell signals are noted at the major highs of the pattern along the way. Again confirmation is needed by a move below the June lows in less time than the rally took to offer logical PROOF that the bull market is likely complete.
Of note on this chart are the red trendlines which were the prevailing uptrend lines for the bull market at the time of the intermediate highs in this bull market. Notice that in both 2010 and 2011, the initial break was somewhat sharp but short-lived, followed by a test of the trendline from the underside before continuing down to lower lows. In the current case, the trendline is less steep, and there is more room underneath the market before the trendline is touched or exceeded. So, it is possible that the current decline is relatively large and sharp and does undercut the June low on the initial trendline break. Then that may be followed by a back test of the current uptrend line before continuation downward.

Click on Chart to Enlarge
The is a quarterly chart of the Dow 30 going back to 1915. A couple points of note here.
1. The stochastics is overbought AT A LOWER HIGH currently, which has only happened 2 times in the 100 years seen on the chart. Both times the market underwent substantial downside with a down/sideways market for 5-6 years before sustained upward momentum again.
2. The dark red upper boundary line from the highs of the 1930's and 1960's highs, acted as support at the 2002 lows, then once it was breached after an initial mild rebound attempt in Sept 2008, the major "crash of 2008" occurred. Since then, price has rallied to touch the underside of the trendline twice in 2012 both times leading to corrections. And price is currently just underneath the line at the recent high. So this may be a broken support that is now resistance and lead to a major correction.
3. Notice the general "head and shoulders" top formation on the chart from 2000 to 2012 if the rally were to complete here. The S&P 500 is similar with a triple top look. While it would be hard to imagine the fulfillment of such a pattern on an arithmetic basis, especially given the downsloping neckline, completion of the chart-based target on a logarithmic projection would put the Dow at about 2600 several years down the road.

Click on Chart to Enlarge
This is a monthly chart of the S&P 500 going back to the 1970's. There are a couple interesting features here.
1. The green lines represent projections of the well know 4 year "presidential" cycle lows in stocks aligning at the 2002 and 1998 lows, then projected both forward and backward (1 is missing at the fall 1990 low). Of note by the blue circle around the current time frame, in Oct 2012 we are exactly half way between the projected lows, suggesting we are entering the downside portion of the cycle now.
2. The next cycle low projects to fall of 2014. My study of this cycle suggests a tendency for the final 1/5 of the cycle (roughly) to be the most bearish portion of the cycle. That would be from the beginning of 2014 until the projected low in this case. So we may be topping here, but still a ways away from the worst of it if a bear market is beginning.

Click on Chart to Enlarge
Now this last chart may be the most telling, the most "beautiful" in cyclical terms, and may be one of the least know types of analysis you will hear in technical analysis circles. See the chart for notes....but here is a summary.
-Since 2000 there is the potential for a continuing 7 year HIGH-HIGH-LOW cycle which also projects the next 7 year low in fall (October) 2014.
-There is a potential 5 year LOW-HIGH-HIGH cycle topping this month (Oct 2012), suggesting downside from here.
-There are 1/2 harmonic sub-components of both cycles present in the intervening bear and bull markets with a 3.5 year bull market from March 2009 to Sept 2012, and a 2.5 year bear market from March 2000 to Oct 2002.
I hope this post has been instructive for the larger picture going on here. My take is decidedly bearish from this point forward in stocks for the next couple years given all the evidence presented here.
Wednesday, October 10, 2012
Stock Market and AAPL Update
10-9-12 Market Update
Check out the video for detailed analysis on AAPL and the general markets. I expect further correction in stocks from these levels, with a possibly major topping process in the works.
Sunday, October 7, 2012
AAPL Close To Trendline and 50 Day MA Break

Click on Chart to Enlarge
This is a daily chart of AAPL. There are several points of note here. It is in a probable set-up for a break of its up trendline, which would likely lead to break of the recent base breakout at $620. I have noted before that a failure of that breakout to hold is potentially longer term bearish.
First, look at the daily MACD. It is showing bearish divergence between the spring highs and the current high. The weekly chart also shows a sharp bearish divergence between those points. Also, there is bearish divergence within the end of the recent leg up between August and Sept. So there is a multiple time frame bearish divergence indicating waning momentum on a large scale. I have already noted the volume divergence in a recent video. The volume divergence is also present on multiple time frames.
Secondly, look at the pink uptrend line. It has already been touched 4 times for support. If it is broken that could signal a correction of the major uptrend for the last year.
Third, look at the 50 day moving average. I have noted this type of occurrence before, but I will review it again as I believe it is an advanced chart reading concept. At key moving averages like the 50 and 200 day MA's I believe program trading often leads to support and near immediate reversals when price touches them. In a stable uptrend price will typically not come back down below the low of the moving average test area. Also, the rebound off the moving average will often be strong with a gap up and increased volume. However, as a trend is beginning to weaken, price may test the moving average and lead to an apparent reversal as program trading comes into the stock. However, the rebound is often relatively weak compared to prior rebounds, and volume is often lower. Then, if price fails to hold the 50 day average or the low of the recent test of the average, it can create a "breakaway" type point where the program trading support is gone and price falls rapidly.
So that is possible here as AAPL recently tested the 50 day MA and reversed off it creating a reversal candlestick. However, the initial rebound has been relatively weak. And price has now come back down to the 50 day MA and is threatening to close below it and below the low of the recent reversal bar. Combined with the uptrend line in the same area, I think a close below the 10/2/12 low could lead to a breakaway move to the downside taking AAPL down probably to the recent base low around $520-530.
If that occurs, then it is obvious that the broad market is likely to experience a substantial correction as well. So keep AAPL on your radar on Monday.
Thursday, October 4, 2012
QQQ Short Trade Set-Up

Click on Chart to Enlarge
QQQ (Nasdaq 100) is setting up for a nice short-selling opportunity. The move down off the Sept high made a minor shift of the price logic to down. Now the correction back toward the highs has been slow relative to the decline keeping the price logic down.
The chart above highlights a probable rally high area in which technical sell signals could be taken for entry with a minimum target below the recent Sept. lows.
The set-up is very similar to what occurred at the spring high this year which I highlighted in this post and in this follow-up post as the entry was completed.
In the current set-up, wait for 30 min or 60 min bearish divergence to show up on the technicals. Then wait for a sell signal for entry. The stop must be above the rally high. If the high is broken the pattern is invalid and the rally may be very likely to continue. For exit, half could be sold if the recent Sept low is broken. Then exit the other half on a technical buy signal (i.e. MACD bullish cross from below the zero line).
Monday, October 1, 2012
Multi Market Update
9-29-12 Market Update
The video covers stocks, bonds, gold, oil, CoT data, AAPL. Tighten stop or exit long equity holdings.
Wednesday, September 26, 2012
Nearing Confirmation of A Correction- But Short-Term Oversold

Click on Chart to Enlarge
This is a 60 min chart of SPY. The MACD is oversold indicating the market may attempt a rally. It would be better to see a bullish divergence develop before considering a new long entry.
Given the momentum set-up with the weekly and monthly stochastics overbought and the weekly now in a sell signal formation, I think the better opportunity is to wait for the likely rally and then look to short/inverse on the next sell signal if price meets resistance at or below the recent highs of 9/14/12.

Click on Chart to Enlarge
The spread between the smart money commercial futures traders and the large speculators is at a 3 year low indicating the smart money is heavily short with a bearish outlook for prices. The last times the spread was this large were June 2009 before a 4 week correction, around New Year's 2009 before the final plunge into the 2009 bear market low, and the first week of Oct 2008 before "the crash" plunge into the Oct 10th low. The time before that was late February 2007 just before a surprise 4% plunge day in the markets and an 8% overall correction.
The point being that there is no other real interpretation of this than at least a modestly bearish one.
The correction off the recent high in the SPY etf is now 8 days long. The prior longest correction since the June low was 9 days. If the decline continues to 1415 on the S&P 500 cash, the decline will be larger than any other pullback since the June low as well. So further downside would create an overbalancing of both price and time suggesting a correction of at least the June-Sept leg up is occurring.
Of note is that open interest rose sharply in the last reporting period with an increase in the commercial net short position. This indicates that there is NEW hedging or commercial short interest coming in at these level. While this may seem trivial, another pattern which occurs is for commercials to go heavily short, and then cover their shorts on falling open interest as the market pushes higher and puts them at a loss. That pattern tends to lead to a sustainable price advance. We are NOT seeing that right now, which indicates that we may be making a very important high here.
Again my suggestion is to exit longs and growth stocks, or trail stops tightly.
Sunday, September 16, 2012
Stock Market Analysis 9-16-12
Stock Market Analysis 9-16-12
This video covers multiple time frame technical analysis on stocks as well as CoT data. Stocks could be making a major top here. I suggest tightening stops on any long positions and growth stocks. Check the video out for further details.
Monday, September 3, 2012
Major Stock Index Selling By Smart Money

Click on Chart to Enlarge
The commercial "smart money" traders increased their selling in stock futures this past reporting period making them the most net short in over a year. The last times they were this heavily short were at the July 2011 and May 2011 tops. While a signal like this can fail to lead to a major correction, in the context of a double top/failed breakout I wouldn't bet on it. At a bare minimum I suggest having in the market trailing stops on long positions or growth stocks. Remember, our goal as individual traders is to observe what the big players are doing, anticipate what they are likely to do next, and to position ourselves with them. So they are more bearish than in the last year or so. Are you?
Combined with a failed breakout of the April 2012 high, this reinforces that a correction is likely from these levels. But as noted in the recent video, it would be out of character for the market to push above the recent August high and then make a correction. A new high would likely be a continuation point.

Click on Chart to Enlarge

Click on Chart to Enlarge
Notice that the bollinger bands are squeezed tightly on SPY. Not shown is the ADX/DMI which shows that the daily DMI has been below 20 for 2.5 months. As it approached 20 two weeks ago, it turned down as the market failed to breakout. Recall several posts talking about this explosive set up in the past. Most recently it occurred in gold resulting in an upside breakout. But the key is the watch for a close OUTSIDE the bands with both bands expanding. When that happens in this situation it typically leads to a sharp price movement, though it may only last 1-2 weeks.

Click on Chart to Enlarge
The VIX/VXV ratio recent spiked lower again similar to what occurred in March of this year. What this mean is that short term volatility is out of balance with longer term volatility expectations. As you can see on the chart, that has often led to substantial corrections in stocks with on overall increase in volatility and a rebalancing of the VIX/VXV. The other possibility is for volatility to remain low and the longer term volatility shrinks to rebalance the ratio. If that happens it would likely be in the context of a continuing low volatility market advance.
As an additional note, the VIX has been running high relative to historical volatility. This also often happens prior to market corrections. The option market does not believe the current low volatility trade is sustainable.
At this point the US dollar looks set to make a continuation of its advance, and commodities have run very hot for several weeks and are likely to correct. So I think we are likely to see a deflationary theme type sell off here again with most assets down and the US dollar up.
Thursday, August 23, 2012
Stock Market Update 8-23-12
Stock Market Update 8-23-12
This video covers this week's attempted breakout of the April 2012 high in detail. Check it out for what will determine a continuation versus a truly failed breakout.
Tuesday, August 21, 2012
Failed Breakout in Stocks Today - Possible Major High and Pattern Completion

Click on Chart to Enlarge
The Dow, Nasdaq 100, and SP 500 all broke their April 2012 highs today. However, after a gap up opening, the market closed lower and formed a bearish engulfing pattern on the daily chart shown above. There is an intra-wave divergence on the momentum study and an overbought RSI. All in all, it looks likely for the market to pullback from here even if it were to eventually move higher. Since today is Tuesday, this weekend's CoT report will include "smart money" response to today's attempted breakout. If they increased selling, then it would be further support to the idea that the market is topping here. The May 2008 high was NOT exceeded, which I would like to see before a major reversal. That would just be an added stop running point which is very typical at major reversal points.
I like to trade major reversals because the risk/reward ratios are so good. But the moving average trend is up and the daily ADX is pointing up and almost at 20 now which indicates a near stable trend developing. So the trend strength is objectively still UP. If long, I suggest a trailing stop method in case of a broad spread reversal.

Click on Chart to Enlarge
The weekly chart shows a strong MACD bearish divergence currently on this breakout. However, another couple weeks of upward prices would put the MACD at or near new highs. So if the breakout fails, the technical set-up is ideal for it to do so right now, not after more upside.

Click on Chart to Enlarge
The hourly chart shows a continuing massive bearish divergence on the MACD suggestive of a downside resolution. When the daily trend gets tight, the MACD may take a similar appearance on the hourly chart, so that is one explanation of the divergence, but at this point I still interpret this as a powerful divergence rather than tight coils within a stable larger uptrend.

Click on Chart to Enlarge
Additionally AAPL formed a high volume dark cloud cover candlestick with overbought RSI. It hit a new high this week after finally breaking out of its recent base. This is a bearish candlestick so it could lead to some weakness ahead. What I think is more telling is that the weekly MACD is now in a massive bearish divergence on this break to new highs in AAPL. This has the "look" of the type of MACD signal at major tops. So be wary of a base failure here in AAPL if in investment longs. The breakout point of the cup with handle was about 620. A weekly close below that level would be very negative for the price outlook on AAPL.
Saturday, August 18, 2012
What Stock Market Final Highs and Lows Have Looked Like
The decline from this April to June in the S&p 500 fit very well in price and time with typical average corrections throughout history. It did not fit well with the typical 1st leg down in a bull market. So on this basis it may have been expected for prices to rally to new bull market highs based on the character of the moves.
Currently, with the markets very close to the year's highs, it seems very likely that the highs will be exceeded, even if this is still part of a drawn out topping process. One thing that I believe many less experienced market analysts or market novices experience is a simple view of support or resistance and expecting or "hoping" that a certain high or low will not be violated because that would throw off their outlook, etc. But from experience I can confidently say that many and probably MOST important highs or lows, actually exceed a prior important support or resistance, at least slightly, before actually reversing into a major new trend. As brief evidence of this I will review the major highs and lows since 2000. The situation at each of the 2 major highs and 2 major lows since then has been for a sharp 1-2 month correction against the trend, followed by a final 1-2 month move into the final high or low.
The last correction prior to the 2000 top was a 56 day 10% correction, which led to a 17% 25 day final advance to the high in March of 2000. The final high exceeded the previous rally high by 5%. It took 4 trading days after the final high for the market to trade back below the prior intermediate high. And it took 13 trading days to close back below the prior intermediate high.
The rally up before the 2002 low saw 29 day 24% advance which led to 20% decline in 49 days into the Oct 2002 low. The final low was 1% below the prior intermediate low. The market closed back above the prior intermediate low on the day of the final low.
The final correction before the 2007 top was a 31 day 12% correction which led to a 15% advance in 56 days into the final Oct 2007 bull market high. The final high exceeded the prior intermediate high (from July 2007) by 1.3%. The market closed back below the pior high on the day of the final high.
The last rally before the 2009 low was a 46 day 27% advance which led to a 29% final leg down in 59 days into the March 2009 bear market low. The March low exceeded the prior intermediate low by 9.8%. It took 4 trading days to regain the prior intermediate low.
Now there are other market cycles that can be studied, and other markets that can be studied, but the tendency is for sharp short-lived corrections to preceed the final legs up or down. And the final legs up or down have been relatively brief at 1-2 months.
So at the current juncture, this is something to watch for. We have already experienced a 63 day 10.9% correction. And we have rallied for over 2 months into what looks like will be a new high. So to fit the mold of a market making a final bull market high, we may be likely to see a mild to moderate break of the April 2012 high of say 1-2%. In this case, I think it would be ideal for the market to slightly exceed the May 2008 high on the breakout as well. This would be about 1.5% above the April 2012 high. Then that should be followed by a reversal to quickly close back below the April high.
So that is a descriptive projection of what a final high for this bull market COULD look like. If we break to new highs, I will track this scenario. And also I will review this with charts in an upcoming video to get a better visual.
Based on the price logic pattern in the markets, I do still expect a failed breakout followed by a significant correction. A move to new highs does NOT invalidate the topping pattern as I have been tracking it. I will go over what level would invalidate that in a future video.
Thursday, August 16, 2012
Be Alert for a Reversal Here
As of today, the maximum time I'd expect for this move up is upon us. Additionally, the daily RSI has touched above 70 on the S&P 500 which is overbought, and in a range environment will typically give break signals.
The ADX is rising on the daily chart as the market is rising here, so we should respect that a new uptrend may be beginning, but it currently is at about 16, whereas 20 is the textbook level to define a new trend. So again, we are either at an imminent reversal point, possibly even this afternoon, OR the market is likely to continue a tight trend higher for several weeks.
The NYSE is poking above the 8060 resistance level I had mentioned recently. It is pretty common for price to go completely through a resistance zone, at least intraday, before reversing. So we should watch to see how it reacts today and tomorrow.
Wednesday, August 15, 2012
Three Push Pattern Complete - Market at an Inflection Point

Click on Chart to Enlarge
The current move up since 8/2/12 is now nearly equal in time to the last 3 "waves" combined. This is typically the time limit for any move of the same degree. So 1 of 2 things is likely to happen, probably starting tomorrow. Either a downside breakout of this tight range occurs and the market makes a significant high. Or the market makes a decisive breakout above this consolidation, and confirms that a larger degree uptrend is in place.
I recently mentioned a three push pattern that could be forming on the hourly chart here. With the recent push to slight higher highs, we now see a clear succession of 3 lower highs on the MACD since late July and 3 wedging higher highs in price. This type of momentum pattern often shows up in rising wedges or terminal impulse patterns, which can both lead to strong reversals.
The next couple days should define the trend direction. I'll update as this unfolds.
As of today the multiple time frame momentum set-up in stochastics is beautiful for a short/inverse trad opportunity at the next daily sell signal.
Thursday, August 9, 2012
Stocks and Gold Video Update
Click on Chart to Enlarge
Wednesday, August 8, 2012
Market Is Likely Making a Top Here

Click on Chart to Enlarge
The current set-up on the stock indexes is nearly ideal for a short trade from my perspective. The weekly stochastics on SPY is overbought. The daily is overbought. And the hourly MACD is overbought with bearish divergence. The pattern is weakening, but may have another slight push to new highs to form a "3 push pattern" on the hourly chart.
We are now seeing lots of confirming evidence for a top in addition to the price indicators. Of note
-very sharp bearish divergence in breadth/McClellan oscillator
-low put/call ratios this week consistent with prior intermediate highs
-2 of the lowest volume days in over 2 years excluding holiday trade. This indicates waning demand or participation buy the big money.
This weekend we will get the data on the "smart" money action in response to the rally over the last week. If we see another jump in smart money selling, then in combination we have a powerful case for initiating shorts or liquidating longs on any technical sell signal.
Subscribe to:
Posts (Atom)