Thursday, May 21, 2015

TLT Dual Time Frame Long Set Up and Nasdaq Doji At Resistance Implicating a Possible Top

Click on Chart to Enlarge

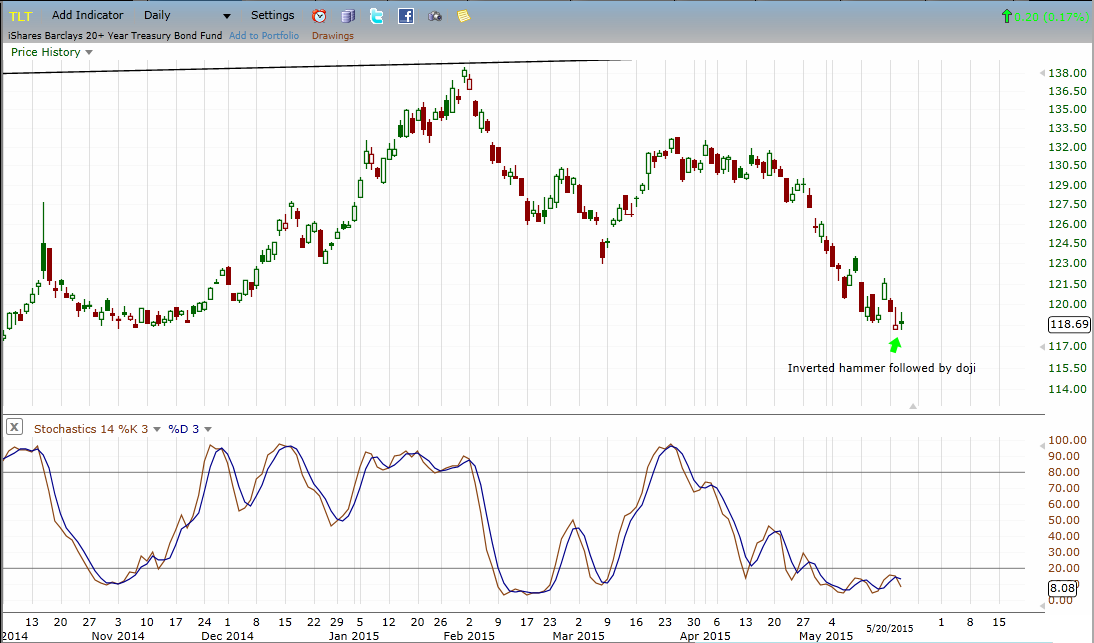
This chart is TLT which is the US long term bond ETF.  For the first time in the current decline since the January high, there is a dual time frame long set-up.  The chart shown here is a daily chart which shows stochastics bullish divergence in the oversold region.  If you click to a weekly chart, the weekly stochastics is oversold also.

Now the last 2 days we have seen 2 successive potential bullish reversal candlesticks.  The first is an inverted hammer, the second is a doji.  A gap up open above the high of today's doji would be a solid signal for bullish reversal.  Now I don't really think that bonds are likely to remain in a long term bull market, but for the short term it seems like the set-up is ripe for at least a multi day rally.

And part of the significance here is that bonds are once again trading largely inversely to stocks since the high in bonds this winter.  This would suggest the potential for a bond rally and stock decline in coming days or weeks.

Click on Chart to Enlarge

The total put/call ratio has given a combination of signals which is certainly more bearish than bullish.  The recent 5 day average close below the 126 day 1 period deviation band last week.  The last few instances of that were right near a point of pullback in the markets - short lived yes, but providing opportunity for recognition to take profits near the top and also to buy short term put options with 100%+ profit potential over the next few weeks.

The hourly chart of the VIX is showing non confirmation with the stock indexes the last 2 days creating another short term warning of pullback.  The hourly TICK averages show the same thing also indicating topping here.

There is a triple time frame weekly, daily, hourly MACD bearish divergence on SPY today which I have pointed out instances of before.  In any case the current high could be the end of a rising wedge or terminal pattern which would implicate a strong downtrend to come.  The alternate is probably that the current consolidation is still a basing from last fall's run up.  So a modest decline and break to new highs, would be a potentially significant bullish event.  

Click on Chart to Enlarge

This chart is the Nasdaq composite.  Today formed a doji candlestick on higher volume - which is often more significant than lower volume as it shows the struggle at hand with increasing activity but no progress in price.  The doji is forming in the region of the recent wide range bearish engulfing pattern which occurred just under the year 2000 all time highs.  A bearish candlestick at resistance should be respected.  A gap down below Wednesday low here would be a pretty solid bearish signal.  Any gap down Thursday with a lower close than open would also be a reasonable bearish confirmation of a doji.  Also notice the overbought stochastics, at a lower high placing this candlestick in a bearish technical position.

I think it would be a great piece of ironic market comedy for the bull market to top here with the COMPQ having reached within 0.2% of a new all time intraday high.  It just is so close that it seems like it has to go through.  And the more time spent right under the high, the more anticipating participants have time to join.....only to be disappointed.  

I am not saying that I have a definite opinion here.  What will be will be.  But make no mistake about it here....the market is giving basically every signal it can that a top is possibly at hand.  So profits should be taken.  Then if price does break to new highs in the Nasdaq, it would seem sensible to buy back into the market with expectation of some continuation on the euphoria and late coming dumb money.


Pete


Wednesday, May 20, 2015

NTAP July 35 Call Option - Earnings Today After the Close

Click on Chart to Enlarge

I bought a NTAP July 35 call option this morning.  Earnings is reported today after the market closes, so this is a known high risk trade.  The rationale is very clear though.  If you check weekly and daily stochastics you can see that both have bullish divergences at yesterdays low.  And yesterday formed a bullish piercing pattern candlestick reversal.  There was a small gap up today, and the option was bought for 1.60, so there is only a modest rise needed for price to reach breakeven.  And a rise to the October 2014 low should move the option up 100%.  On a successful bottoming pattern in a stock, an earnings announcement in this position will often lead to a gap up which breaks the down trend line.  So I would expect a gap up to above the 36.25 level if the bullish formation continues.


Click on Chart to Enlarge

This chart is also NTAP but shows a 20 period money flow index.  The interesting thing here is the massive bullish divergence in money flow index.  It is at a multi month high as price is hitting lower lows.  If you look back at the low last May previous to earnings, there was a nearly identical bullish divergence pattern in advance of the earnings announcement and breakout of the downtrend.

Understand here that if things don't go as expected, the option will lose almost all its value, possibly rapidly.  So consider this for educational purposes.

Friday, May 15, 2015

WDC Call Option Order - 400% to 700% Gain Potential Going Into July Expiration

Click on Chart to Enlarge

I have an order to purchase July 100 calls on WDC tomorrow for 2.90 or less and the July 105 calls for 1.25 or less GTC.

There is a very nice price logic set up coming down off the winter high relative to the fall Oct 15 low.  There was a very nice dual time frame stochastics buy signal at point C with the daily chart showing bullish divergence while the weekly was oversold.

Then the downtrend line for the correction was broken with a small gap up and many technical indicator buy signals were given in the brief run up to follow.  After the brief run up, a minor correction occurred bringing price right back down to the break out point of the trend line.  This coincided with the average retracement level where a stochastics < 50 signal will occur after a pattern like this breaks out from a completed bottom.

Additionally, the April earnings announcement occurred during that pullback and price held support on the gap down and has since risen.  So the earnings announcements are out of the way until the summer.

Based on the typical projection for the price rise to follow such a pattern, we could expect price to exceed the winter high at the $114 level by July expiration or sooner.

If the move up which is beginning now makes a wave 3 type Elliott wave move and is 161.8 times the size of the initial move up from point C, then that would also project to the winter high around $114.  And if it does unfold like a wave 3, it will be very directional and would produce a 400% gain and 700% gain or more on the options respectively.

So, with the broad market near new all time highs, it will be interesting to see if it breaks out and continues, with the Nasdaq eclipsing to 2000 high finally.  If so, it would bode well for WDC to carry higher as this pattern moves forward.

Pete

Monday, May 11, 2015

Major Consolidation in Stocks Since December - Breakout to Upside Probably

The action in stocks since early December has been very choppy but with a slight upside bias.  I have posted previously that the pattern may be an ending diagonal which would imply a very sharp downside move to follow.  However, another break to new highs would strongly suggest that the market is not ready to break down.  Any declines have been repeatedly bought, and there is no downside price action confirmation of anything larger than minor multi day moves.

So at this point it seems with markets hovering just below all time highs, that an upside breakout is awaiting.  I would suggest that it would be sensible to buy new all time highs in the S&P or Dow with stops under recent minor support.  Then a trailing stop technique can be used to lock in profits if they come to the upside.  Also, we can monitor closely for bearish divergences to develop after another run up.

An interesting point to note is that on Wednesday's decline last week, the low of the day was below the Dec 5th high, basically putting the market at a flat or tiny negative gain for the past 5 months.  Understand that in a bull market, that is a significant consolidation - 5 months with no price gain.

Then Thursday the markets rebounded from oversold conditions.  On my bottom spotting algorithm, it was not flagged because Thursday did not make a lower low.  However, the futures from Wednesday to Thursday morning did make a lower low.  So in the futures session, it was basically the type of action that my system will flag as a short term bottom inflection point.  Then Friday the markets gapped substantially higher, which I have seen many times the day following successful bottom reversal picked up by my system.

So my take here is that stock prices are behaving still in bull market fashion and appear to be more likely to break to new highs.  That would also allow the Nasdaq to push into new all time highs which would seem sensible given the way old highs and lows typically are exceeded prior to major directional changes.

Given this outlook, I exited my XLF put options and SKF position at losses.

I plan to buy the breakout to new highs with expectation that a substantial run up for about 3 months may occur.  I view the May 6th low as the last sentiment and price logic point at which a consolidation could have completed, and I view a break of that low to be a stop loss point for longs buying the breakout.

I will adjust stops using a moving average channel technique if price breaks out and continues higher following the breakout.  Additionally, if there is a classic topping candlestick pattern on the Dow 30 after a breakout to new highs, that still falls within the bounds of the rising wedge (below 190.00 on DIA) I will make note and either exit, partial exit, or move stops up to reduce risk in the face of a market with bearish divergence and a topping formation.

Pete