I have run a few backtests comparing market conditions on the close last week against past data. On the balance I would have to say that the short term (1-2 weeks) forward expected return is neutral based on the combination of criteria I looked at.
Now that is just going off of past data. In actuality there seems to be very little chance that the actual returns will be neutral or muted. The Dow 30 has coiled sideways in a narrow range for 2 months straight, which is very unusual. It seems obvious that markets are awaiting further information to be generated before moving directionally.
One of the basic ideas related to market movements is that long basing periods represent pent up buying or selling supply and demand. And so once the range or base is broken, there can be a significant price movement.
So I ran a little though experiment, with the Dow's current tight price action in mind.....
Historically, in the SP500 a typical "leg up" (without a 1 month high to low correction) has lasted about 4.5 months or a little over 90 trading days. And a typical gain in a leg up has been about 25% for the SP500 average. So there are obviously some up and some down days even in a trend, but the average close up would be roughly 0.25% for the duration of the trend based on these numbers. (That includes the down days). And a typical leg down would show even a little greater magnitude average LOSS per day.
So here we are with the stock averages just moving sideways for 1-2 months. Let's say there is actually 1-2 months up pent up buying or selling at 0.25% per day. Just 21 trading days of average 0.25% gain per day is 5.25%. So what I am getting at here, is that stocks could rapidly move 5-10% once the new trend or reactionary phase begins after this flat, tight base completes.
Now based on price patterns and cycles, I feel the likely outcome will be for a market sell off to occur in the wake of this tight range. But don't be surprised to see a rapid price change over a few weeks time based upon the pent up supply or demand.
Pete
Monday, October 31, 2016
Tuesday, October 25, 2016
Short Term Market Action Suggests to Me That Stocks Will Fall Starting Late This Week or Next

Click on Chart to Enlarge
This chart is an hourly chart of SPY. What we are seeing here is an obvious overlapping type short term action, not a directional upward movement that would signify major buying interest.
Notice that the overlap has occurred underneath 2 trend lines, one from the consolidation beginning in September. The other origin is not shown, but is a trend line from Feb 2016 lows to the June 2016 lows.
Also interesting is that the 214.50 level is level that SPY was trading at just prior to the last FOMC meeting announcement. It had been support for the triangular consolidation in September. Now prices have met some mild selling each of the last 4 times price attempted to reach that level.
The next FOMC meeting is next week. And so we could possibly see some market movements with higher volatility next week.
Currently I am positioned in 3x leverage (SPXU) at ~24.00. Also, the banking sector stocks and brokerages have hit the extreme end of their harmonic reversal zones and it looks like today could have been the final day up in that major rally in big banks.
Based on what I have posted here in recent weeks, as well as the larger prices pattern and cycles, it seems likely to me that a substantial move down is imminent.
But we shall see.
Pete
Monday, October 24, 2016
Current Market Action Still Seems To Show Greater Downside Risk Than Upside Potential Here
Over the past few market sessions I have back tested a number of different combinations of market conditions which are currently, and I am not seeing much in the way of forward bullish skews to the data. Most everything I have ran which matched current market conditions were neutral or slightly bullish short term. But there are a few studies which have shown consistent skews to the bearish side which are significant. So my take away is that, stocks could break lower in coming weeks after this chop ends.
I don't have any insight into how the market will behave from now into the election time when considering the singular effect of the election.
One scan I looked at today is the following conditions:
I don't have any insight into how the market will behave from now into the election time when considering the singular effect of the election.
One scan I looked at today is the following conditions:
- total put/call ratio < 1.0 today
- 5/63 day total p/c ratio less than 1.0
- VIX high less than 13.5 today
- VIX closes lower today
- VIX/VXV ratio is < 0.85 today
- SPY gapped up today
So basically we have a low VIX environment (which may be a contrarian signal, but not necessarily a timely one) where sentiment based on the put/call ratios has been toward the complacent side of average recently, and SPY is gapping up.
These occurrences can occur in clusters, and so I removed any redundant days after the initial day in a cluster, unless they were more than a week apart. And the results were that all the time frames I compare from 3 days out to 2 months, showed a 2-3 times greater MAX loss versus MAX gain from the signal day (today).
Let me briefly say, that there are not many "random" scans that show such a lopsided skew to the downside in stocks. Since stocks spend so much more time generally rising than declining, when we see these types of imbalances in forward returns to the downside, I typically take it as more significant that stocks are at risk of declining.
Volatility rises when stocks decline, and so a significant price decline may occur rapidly in comparison to the steadier trending which may occur in an upside move of the same amount. Part of my point here is that I have found it far less easy to find scannable market conditions which consistently demonstrate impending market declines. What we more often see are windows with a skew to the downside, but with less precise ability to pinpoint "the top" in comparison to pinpoint a bottom where prices are likely to rebound.
And currently for the last roughly 3 weeks some scans have shown that looking out a couple months (or more) there is risk of downside. So it may end up that most of the trade is choppy but then there is a week or so with a big price break where the losses really show up.
What I am choosing to do here is to get positioned in inverse ETFs with a time horizon of 2 months out as the "time expiration" on the trade. From some other cyclical type analysis that I follow, it seems most likely that the downside would occur in November, or into December, assuming we do get a sell off of significance.
Pete
Friday, October 14, 2016
No Clear Directional Bias Currently Based on My Backtests in SPY
Yesterday and today I have looked a several scans investigating MACD position, stochastics, bollinger bands, 3 month low reversal attempts, real money sentiment measures, and the balance I would have to say is mildly bearish looking forward a couple months from yesterday's close in terms of MAX losses versus MAX gains.
Basically it seems the the intermediate term of the next couple weeks or possibly longer has some downside currents. So real short term or swing style trading may be best on selling rallies.
It would be nice to see more of a hard sell off in order to set up a bullish rebound attempt. The best trades I ever see in my scans are bullish set ups after hard sell offs. Even in down trends there are often sharp rebounds for a few days, and the weekly options offer attractive opportunities, and the upside skew can be very nice for ETF plays with wide stops and limits.
Pete
What If SPY Breaks to New Corrective Lows From Here? 10-14-16 Stock Market Update
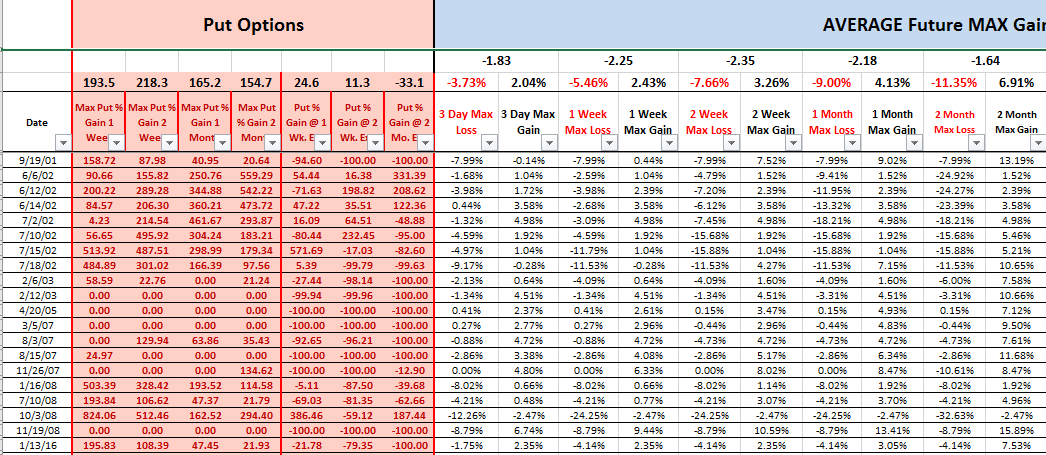
Click on Chart to Enlarge
First let me immediately state that this study is NOT currently active. It is a "what if" scenario. What if SPY ends up breaking this Thursday's low with a weak close in the bottom half of the range?
That would be a reversal failure type scenario because yesterday price broke to a 3 month low, and reversed to close above it. So basically I am posing the question of what happens if a reversal attempt from a low (with bullish divergence in sentiment) fails to form a low which holds.
What the table demonstrates is that a break to new lows would suggest a bearish skew looking forward based upon historical comparisons from the last 21 years of SPY history.
The skew is pretty strong out to 2 months later, with greater MAX declines on average than MAX gains. Looking at the 2 week forward time frame, there have been some significant declines following these breaks. If trading the options, the maximum expected value play for my system involving at the money options, would be to buy an ATM put with 2 weeks until expiration, and set a limit order gain of 200% to exit the trade. The win rate on the past instances was only 44% and the Kelly Bet was low at about 15%. So it would justify only a smaller position but the expected value was strong at ~32%.
What about the equity side of things? Well first off there is a difference between just shorting on a stop order to new lows versus letting the break to new lows happen and then waiting to see if prices are able to again reverse higher. The backtesting suggests a stronger downside skew if prices break to new lows AND close in the lower half of the range. So that is the scenario the above stats are for, and what the strategy would be here on the ETF side.
Based upon my system and backtests, if we entered short SPY at the close of a failure day as discussed in the above paragraph, and set a stop order 7.75% above prices in SPY, and a limit gain order 7.75% below prices, but exited at the close 9 trading days later if the orders weren't hit, it would produce a nice 2.36% expected value. That is using SPY unleveraged. The back test stats justify 3x leverage on the short side in this case though. And the win rate was 64% on the past 25 instances.
So we could expect about a 7% gain on average using the 3x short ETF like SPXU or SPXS.
That is a very nice set-up for profiting quickly in a down market.
So if there are questions on this let me know. But if you use alerts, you could set an alert on SPY if price moves to 211.20 or lower to make sure you understand that price is breaking to new lows and this set-up will be in play if the day's close is weak (below the mid point of the day's range).
Pete
Thursday, October 13, 2016
Another Small Sample Study Showing Potential For Sizeable Sell Off - 10-13-16

Click on Chart to Enlarge
Today as of the open, SPY is opening below the lower bollinger band. With no other filters, this is a neutral occurrence in terms of forward returns based upon backtesting.
Adding a stochastics fast line to be below 20 still shows a pretty neutral forward skew of max gains vs losses.
But the table above adds just one filtering criteria which is that the previous day closed UP. In our current case SPY made a small close up yesterday and closed above the bollinger band. Now today we are seeing an oversized gap relative to the range in order for it to open below the lower bollinger band.
In the past instances, the table demonstrates another significant skew to the downside in the short term. In this case, as with the study on MACD and stochastics crossing down on the same day, we see some pretty sizable short term sell offs beyond random MAX draw downs.
Now most of the losses occurred in the first 3 days proportionally. So, I am just making further noted here that we could see a swift decline. But that decline would very likely produce some back test studies which offer bullish trade opportunities.
Again this is a smaller study, and stocks certainly could rally right fro mthe open, but be aware of the context here and possibility for sell off.
Pete
Tuesday, October 11, 2016
Another Small Sample Bearish Study Triggering Today
I ran a scan which looked at
- daily 14,3 stochastics crosses down from above 50
- weekly MACD is down
- daily MACD is down
The results showed 20 instances going back to Sept 1995. The MAX loss was 4 times as large as the MAX gain over the next 2 weeks. This signal is occurring today.
When I added the conditions of the daily MACD line being below 0, the results were also very bearish. And when I added the additional condition of today being a cross down on the daily MACD (from below 0 still) there were only 4 instances going back the 21 years.
Dates were
8/27/1998 - ~9.5% loss within 3 days
10/4/2005 - ~2.5% loss within 3 days
8/19/2015 - ~12.5% loss within 3 days
9/26/16 - sideways trade for 2 weeks
So check these on your chart. The most recent one 2 weeks ago led to nothing of significance. Just a historically unusual sideways pattern.
But the other 3 had massive skews to the bearish side. About 10:1 skew to the downside over the next 2 weeks.
I know it is small sample size. But may be of note.
Some other studies looking at volume increases and price declines similar to today show a mild to moderated bullish picture for 1-2 weeks on average.
So it seems like the most probable scenario is a modest rebound over the next 1-2 weeks back up into the range we've been in. But there may be a greater than typical risk for a quick sell off of large scale.
I will keep this under watch and post if there is relevant info to follow.
Pete
Investment Banks Look Like They Will Sell Off Hard In Coming Months - 10-11-16

Click on Chart to Enlarge
This chart is Bank of America, BAC and is a weekly chart with the stochastics visible beneath. Here we have basically a picture perfect pattern formation of a major top reversal.
A few points of observation:
- Notice the decline off the 2015 highs created a larger (and faster rate of decline) decline than any pullback during the bullish run since 2011. This creates what Gann referred to as an overbalancing after the end of a price trend.
- The broad market indices like SP500 and Nasdaq have made new all time highs in 2016, but see that BAC has not rallied back to new all time highs. I call this a non-confirmation of the broad market trend and implies future weakness in the stock.
- The rally since the lows in the winter, has taken longer to form than the preceding decline, both from the all time highs, and the secondary lower top in Nov 2015. This price action implies a new downward trend in that the larger and faster moves are in the downward direction. the explosive, higher rate of change moves have been to the downside.

Click on Chart to Enlarge
This chart is a daily chart of BAC, so it is zoomed in some. Further observations....
- Notice the overlapping nature of the move up since February. Boundary lines for the move up since February would form a rising wedge type pattern.
- The rally is now peaking in an area of prior price congestion and multiple gaps downs from the winter decline. This could be a chart/price based overhead resistance zone.
- The MACD on this chart shows a major bearish divergence with price at the price peak yesterday. This divergence at a lower high (than the beginning of the prior declining move) implies exhaustion and completion of a price move at a lower high, again indicating a downtrend likely to continue.
- The recent poke to new highs and reversal below the old high, creates a mini failed breakout or double top, which may be a final smart money selling point as they sell into the break to new highs and attempt to unload right at the top.
From this point, a high quality top reversal pattern would be unlikely to make any further advance. If a major price decline is to unfold, it would be ideal or not uncommon for price to gap down through the rising red trend line of the recent leg up since this summer bottom.
Assuming there is a sharp break of the red trend line, it would be quite common for price to rally up to very near the price level where it broke the trend line. That would often occur with a daily stochastics rally to above the 50 mark. And the most common short term reversal candlestick to occur at that backtest point on the chart would be a bearish engulfing pattern based upon my observations.
This quality of pattern will likely retrace back to at least the mid point of the recent rise. It would take a major correction or bear market environment to fulfill a complete retracement of the rally since February. But given the current position of the broad stock indices, the bull market could be topping here.
Similar comments apply to charts of SCHW, MS, AMTD, ETFC, CFG, C.
This will be interesting to observe in context of the upcoming US election, and a potential reversal of the long period of no interest rate increases by the Federal Reserve. The next FOMC meeting and announcement of interest rate changes is November 2nd. Election day is the following week on the 8th.
So it will be interesting to see if the Fed goes ahead and makes the rate change at the upcoming meeting just prior to the election. But if not possibly wait and make the change either after the election or after inauguration.
From the observation of these price patterns on major national financials, it seems like the time for an "event" catalyst to bring the next major wave down.
Pete
Subscribe to:
Posts (Atom)