Tuesday, May 31, 2016

Quiet Volatility in Stocks - What's Ahead?

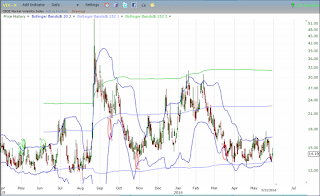
VIX with Standard Deviation Bands
This chart is the daily VIX chart with some standard deviation bands.  The standard bollinger bands are the dark blue.  The light blue is a 1 standard deviation of the 252 day average of the VIX.  The green band is a 3 standard deviation of the 252 day average.

The VIX has a skew in its data in that it will spike to the upside and not to the downside.  So there is not an "even" distribution of VIX readings above and below the average.

In the past when the VIX has hovered around the light blue band, that is a longer term complacency signal.  And while I don't have a way to quantify this currently, I would suggest that a spike to the upper light blue band would be likely on a legitimate correction in stocks.  At this stage in my estimation stocks may hold up for a while, but without much major upside progress.  

That being said, SPY is back up into horizontal resistance of past prices, and there are plenty of stark divergences present as prices are pushing towards new rally high coming off the winter lows.

The scans that I have ran recently have been consistently mildly bearish in the short to intermediate term on average.  However, the reality is that in some past instances comparable to the current environment, stocks got hammered big soon after.  Other times, stocks just meandered higher in low volatility type trade.

So,  from a trading perspective, it would make more sense to me to do nothing, or take a small out of the money position in options to profit in the event of a big market sell off.  I will try to quantify this a bit further and see if there is any rational profit expectation that I can find comparing to the past similar markets.

Pete


Wednesday, May 25, 2016

SPY Closes Above Upper Bollinger Band At a Lower High

Very recently SPY was trading down at the lower bollinger band, and I noted how the set-up was probably indicative of a bullish move to come, but not one that I felt had a strong enough profile to put money on.

Now a week later, SPY has rallied strongly up and closed above the upper bollinger band.

An interesting note here is that the price of SPY is below its recent price peak from April 20th.  Now it is not far below, but all the same I think it is potentially significant.

I ran a simple scan that looked back at the history of SPY for times when....

  • SPY closed above the upper daily bollinger band
  • the price high for the day was at a lower high than the price peak for the previous 2 months
We could refine this further, and I added a few other conditions to the scan, but they didn't seem to alter things significantly.

The result was a bearish skew over the next couple months.  As with many bearish set-ups that I test, there were a few huge winners, but not a super high winning percentage.

There were profitable plays in both the equity and options, but neither with the impressive criteria that I would want to put money in play.  Now any time there is a clear profit, it could be argued that the trade could/should be made.  However, what I have found is that the opportunity cost of tying the money up, and the possibility of an even more profitable set-up developing soon are both too high to justify taking a modestly profitable trade.

So that is the scenario here.

That being said, I would not be surprised if this set up led to a huge gain over the next couple months.

My take on this is that this current rebound in stocks is probably a brief rally in a market that is weakening.

Pete

Thursday, May 19, 2016

SPY at Lower Bollinger Band

I ran some back test scans today focusing on times when SPY had touched the lower bollinger band during the day's trade action.  I looked at reversals from the lows after touching the bands.  I looked at returns following 3 or 4 gap downs in a row.  I looked at similar instances combined with elevated put/call ratios, etc, etc

I found some mixed results.  One factor which seemed significant is that when the VIX was lower, it was more likely to see negative forward returns.  When the VIX was higher and put/call ratio was higher, there were short term rebounds expected which provided bullish trade opportunities.

Looking ahead tomorrow, if SPY has a big down day and closes below the lower bollinger band, then there will be a set up in play which has been profitable for a 1 week at the money call option purchase.

Three or 4 gap downs in a row, with the current day closing below the open or below the lower bollinger bands are both set-ups with bullish short term skews.  So this should be on our radar.

Click on Chart to Enlarge

Here again we see a VIX bollinger band set-up which has been very timely showing short-term imbalances in the past which have preceded rallies.

From the visual look of the chart of SPY and the VIX set-up I feel that the upside should be favored in the short term, but there is not really a concrete back test which is extremely supportive of putting money in play here.  But again, if tomorrow is another big downer, then we may be at a point to try to catch a brief rebound attempt.


Pete

Wednesday, May 11, 2016

Stats for A Call Option Set Up From Last Week

Last week as prices reached the lower bollinger band on the daily time frame, the previous bearish set-up and trade recommendation was exited at its target profit.

There was a reasonable bullish looking set up at that point, though I did not run any scans looking for the bullish edge.  One notable feature was a modestly elevated total put/call ratio at the end of last week.

In retrospect I ran some scans and found a profitable set-up which occurred on 5-5-16, last Thursday.
Scan criteria were as follows:

  • 5 day average of total put/call ratio was 1.1 or greater
  • SPY closed down 3 days in a row (or more)
  • %K of the daily stochastics (14,3,3) was less than or equal to 20
So this scan indicates a period of at least short term elevated fear as evidenced by the put/call ratio being high.  Also, the stochastics is "oversold".

Results for the options are listed in the table below.

Click on Stats to Enlarge

For a 1 week until expiration at-the-money call option purchase, setting a limit order to exit the trade at 100% profit or letting the option expire worthless yielded the best profit scenario.  In this case it was basically a 60% chance for the option to double.  

I am posting this here for future reference and addition to my database of profitable trade set-ups.
The equity side of the trade did show a profit opportunity but not one that I felt was exceptional to post.

So understand that this trade is not a current recommendation.  The trade was already triggered and actually hit its 100% profit target yesterday, and would be closed already.


Pete


Friday, May 6, 2016

SPXU and SPY Puts Both Achieved Profit Targets

As of today, the 100% gain limit order to exit the SPY May 20th 209 strike puts bought on 4-20-16 has been filled.  

So the SPXU and SPY trades entered 4-20-16 are closed for tracking purposes.

SPY touched its lower daily bollinger band today.  And price has reacted by rally off the lows.  While price certainly could continue the bullish run and move to new highs, the rally may be a technical "blip" based upon the factors mentioned in the last post.  The overall level of panic or real money negative sentiment (by the measures I use) was very modest on this decline.  Many corrections achieve a higher level of selling pressure than this before bottoming.

In any case, currently I see no strong edge in the market for initiating new positions.  So for trading purposes, I suggest staying on the sideline, until a very profitable back tested scenario arises.

Pete


Thursday, May 5, 2016

Stock Market Perspective 5-5-16 - Choppy Trade Ahead?

Click on Chart to Enlarge

The chart here is SPY.  This is a daily chart.  On a short term basis here are some observations.


  • SPY has closed below the 20 day moving average, but not yet touched the lower bollinger band.
  • The price is not far up from the lower bollinger band.
  • Price is hovering a little above the 50 day moving average.
  • The 50 day average, the lower bollinger band, and the 200 day moving average are all within about 2% below current prices.
What I have observed over the years is that clusters of prominent technical averages can lead to some overlapping trade.  What I think occurs within the computerized market, is that trading programs are often made using these indicators and so orders get placed around the price points.  And the job of the market is to fill the orders.  That's were the market makers get paid.  Basically the more transactions which get executed, the better.  So in the way that all the market forces tie together, price ends up touching and reaching all those key indicators, and then often as soon as it is "triggered" price reverses, at least in the short term.  So price bounces around these technical clusters until the weaklings are weeded out and the order books are lighter.  Then the market is "free" to do what it will.

So in this case here, while there are some early signs that stocks are short term oversold, and a rebound could be imminent, my feeling is that these target indicators under the market, coming of an intermediate term high set up, will attract prices lower in coming weeks.  It may get kind of choppy for several days.

For or purposes, the SPXU inverse trade recommended a couple weeks ago already is closed at a 7.5% profit.  Depending on the fill of the SPY put option, it has possibly reached a 100% gain and exited.  Or it may be a little shy of that target.  My expectation is that with 2 full weeks of trade to go, the order will likely get filled if it has not already.

I will post any compelling set-ups as they unfold in coming weeks.


Pete


Wednesday, May 4, 2016

Probable Trade Exit Today on Recent Inverse ETF and Put Option Purchase

SPY is trading at about 204.70 at 9am EST today.  And any further push lower is likely to trigger the limit orders suggested in the recent trade recommendation post.  And again the put/call ratio sell signal was timely particularly in conjunction with the MACD daily time frame divergence and stark breadth divergences, etc.

It is possible that the ordered suggested would already have triggered the exits depending on how perfect the entry was after last post.  But I am using the opening price on 4/20/16 as the reference prices.
So the SPXU opening price on 4/20/16 was 27.10.  And a 7.5% gain (~2.5% loss in SPY) would be a limit exit of 29.13 on SPXU.  And the May standard 209 strike put opening price was 2.68 on 4/20/16.  So the 100% gain limit order would be 5.36.

Those order seem very likely to trigger with any slight break of last week's low.  And that is were SPY is trading currently.

From the hourly chart technical analysis, it looks to me like SPY may move down to 203 before having any short term support.  So it may be possible to get better gains than those listed above.  But for simplicity either just stick to the orders above, or exit half the position at those orders and adjust the other half for the equivalent of a SPY @ 203.00 exit.

Comment if there are any specific questions on this.


Pete