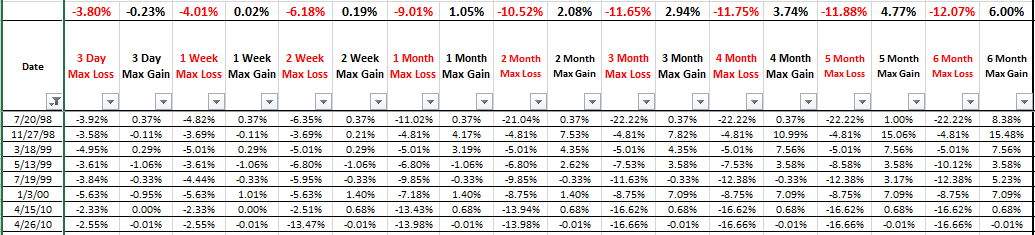
Click on Table to Enlarge
Last week I showed stats from past instances where there was a 1.5% decline in SPY the day after a 52 week high. And the average displayed a notable bearish skew for the next couple months, though about half of the instances rebounded back to near the highs after that initial big sell off day.
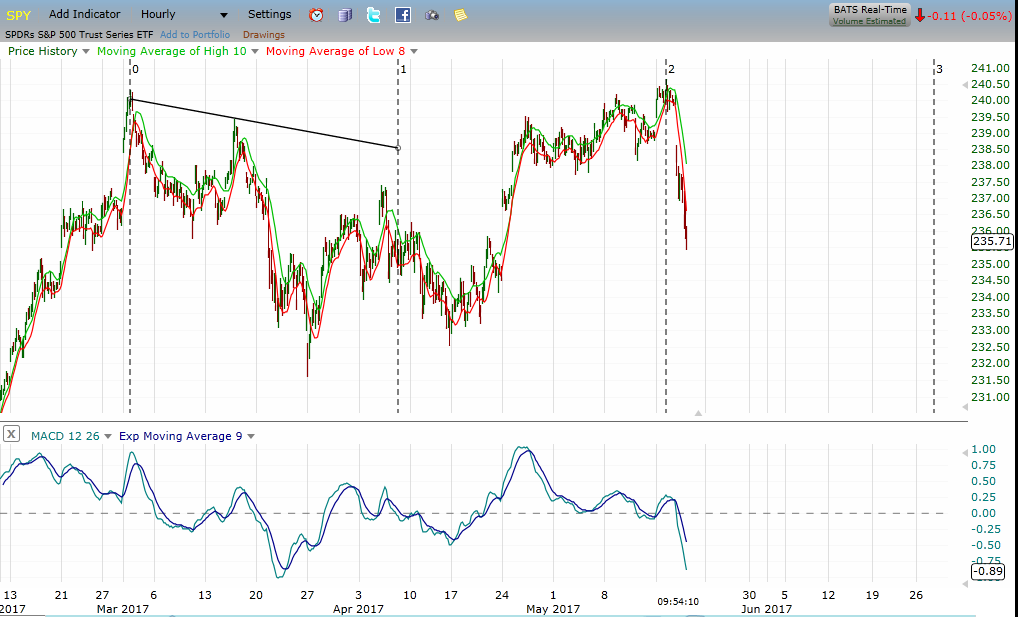
This rebound scenario is what we have seen in the current market.
I have run a couple scans over the last few days, and it still appears that similar past markets have had a notable bearish skew looking forward a few months,
The chart above shows the forward MAX gains and losses from a scan including bearish divergences in VIX, total put/call ratio, volume, MACD and stochastics on daily and weekly time frames. So basically just an across the board price and real money sentiment bearish divergence. And the bearish skew is notable for the first couple months.
Another scan criteria looked at unique instances when there was both daily and weekly bearish divergence in the MACD when the VIX closed below 11. The results were similarly bearish.
There are good trading opportunities here based upon my method and the data at this point.
Based upon past SPY data, shorting here and setting a limit order to cover at 5.75% gain while also setting a 5.75% stop loss would provide a roughly 2.25% expected value over the next month. The trade would be exited after 21 trading days if neither stop nor limit was filled.
Any where in the 4% to 6% paired limit and stop orders basis SPY would be very reasonable plays. And 4% the ratio of the risk to the expected value is the lowest, and after that there may be higher expected values with wider orders, but the risk rises more than the expected value increase does.
I am electing to purchase SPXU here and use 12% limit and stop orders. The simplest way to do this is with an OCO, one cancels the other, order where one order is a sell stop and the other order is a sell limit. Then set a time reminder to exit on June 26th if neither order is filled already.
For the options side of things, a 130% limit gain order from the closing price yesterday on a 241 strike June expiration put option, would provide a very positive expected value with about a 66% win rate based on past similar instances and the calculation of my algorithm. For this trade, there is no stop on the option. It could expire worthless, but a limit gain GTC is set immediately after entry.
Pete