Wednesday, March 30, 2016

Daily Time Bearish Divergence in Money Flow Index and MACD - SPY 3-30-16

SPY and Money Flow Index
SPY Overbought Money Flow Index with Bearish Divergence
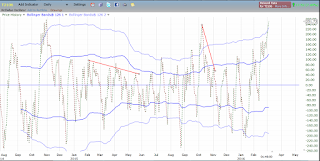
This daily chart of SPY shows the 50 and 200 day moving averages which are in a longer term downtrend currently (50 day below 200 day) as well as the 14 period money flow index with a 14 period moving average of the MFI.

What is apparent is an overbought MFI with both the raw MFI and the 14 period average in the extreme region.  And now, after a small pullback and MFI (brown line) dipping below its average (blue line), price has moved to a new high, but the MFI is at a lower high creating a classic bearish divergence pattern on this indicator.  This type of pattern has occurred very near to the final price highs before significant pull backs in SPY over the last couple years.

In an up trending market, I'm sure that the end results could be uneventful.  However, given the moving average downtrend configuration, I believe that this signal should be respected as an exit signal for longs.

I don't have a strong opinion on whether the bull market is complete, and a major decline will take place, though given the Commitment of Traders data on the rally up since February, it seems reasonable that this whole rally has been a short covering move with no big money new interest taking place on the long side.

I will look at speculative opportunities on the downside possibility to come from these levels.


Pete

Thursday, March 17, 2016

VIX Bollinger Band Sell Signal on Stocks at SPY Gap Fill

VIX Hourly Chart with Bollinger Bands Giving Sell Warning for Stocks
Today the rise in stocks coincided with a dual time frame VIX sell signal which I have highlighted many times here on the blog, with basically all being timely early warnings that a rally in stocks is ending.  The easy money is made, and the downside risk outweighs the upside potential in the near term.

As noted above the hourly VIX closed below its lower bollinger bands on 20,2 and 126, 2 settings and the 20, 2 lower band was below the 126,2 lower band.  What this means in short, is that the VIX is at an extreme low level relative to the longer term trend.  This typically lead to some mean reversion or some type of smart money activity understanding the imbalance, and price halts its directional move.

SPY gap down at 204 is now filled with extreme short term complacency in the options market
Today's action in SPY filled the open gap down at 204 on SPY.  This is the open gap down level which I had discussed a few times as the obvious target for the rally.  Now as a side note, after observing action of individual stocks at support and resistance levels around large gaps, I have observed that a common mode of price action is for the gap to be completely filled prior to the final counter trend price move high or low being in place.  So what often happens, is after the gap is filled, price reacts briefly (in this case it would likely lead to a brief sell off in stocks) and then price moves to a new extreme for the counter trend move which creates a more classic divergence pattern in the technical analysis and a more likely final high or low.

So in our case, this would suggest that SPY may briefly sell off here, and then rally up to new high for the move which would likely be in conjunction with stark daily time frame divergences in the MACD and other indicators.  This would also, likely allow time for the weekly stochastics to cycle up to an overbought reading and create a dual time frame signal with weekly overbought, and daily overbought with bearish divergence which is a great sell set up in technical analysis.

I don't have a real strong opinion here as to whether the bull market is over or not, but there are multiple signs that the current trending move to the upside is about to stop and lead to some choppier action if not an outright downside reversal.

I will update with stats in the near future.

Pete


Friday, March 11, 2016

McClellan Oscillator, NYSE TICK, and VIX All Showing Bearish Divergence With SPY

On today's rally in SPY up to touch and close above the 200 day moving average, there are multiple short term divergences occurring.  This indicates that stocks could pull back from this level immediately.  However, in a previous post I had highlighted unfilled gap downs on SPY, with the 204 level being a likely target for this rally, even if the market were to roll over into a bear market.
So currently, that gap is still unfilled and only about 1% above current levels.
McClellan Oscillator Overbought with Bearish Divergence
 McClellan Oscillator is now showing a sharp bearish divergence today after a recent overbought reading.  If stocks are in a counter trend rally to a long term down trend, I would expect the top to occur very quickly.  Counter trend moves tend to create a spiky short divergence pattern in the McClellan Oscillator.  If stocks are going to move to new bull market highs or have a sustained rally, a more sloppy drawn out divergence pattern is likely to emerge.

NYSE Tick Showing Bearish Divergence on Hourly Time Frame
 This is an hourly chart of the NYSE TICK index which is a short term measure of breadth.  We currently see a sharp bearish divergence relative to new price highs in SPY today for the rally up from February lows.  This again implies that the trends ability to sustain is in question.  What is occurring is that fewer stocks are moving higher than were earlier in the move.  That is classic action as a move tops.
VIX Showing Non-Confirmation Relative to SPY
Since the VIX is correlated inversely with stocks, we would expect the VIX to make a lower low when stocks make a higher high.  In this case, the VIX did not quite make a lower low.  The hourly VIX chart shown here shows that the VIX is hovering above the longer tern bollinger band on this time frame.  If the VIX pokes down to this level, that would be further sign of a statistical extreme and probable mean reversion ahead.  So let's keep an eye on this.  But even as it stands, this is a bearish type of signal.

Certainly as price has moved up to the 200 day moving average and daily stochastics shows a bearish divergence, money flow index is overbought, and the short term measures here are displaying bearish divergence, I think that for trading purposes, anyone who is long would be wise to exit.  That way you are out of the market and ready for the next move.  Expect that it will be a few days or more before stocks make a possible top.

Keep in mind the stats I recently showed regarding a SPY inverse etf trade, or a SPY put option trade.   Those looked at price movements likely over the next 1 month.  That study is still young, and implies that with the pop higher today, the reward to risk profile may be even better.


Pete

Wednesday, March 9, 2016

SPY Put/Short/Inverse Trade Stats Suggest an Outstanding Opportunity Here 3-9-16

Click on Stats to Enlarge

In follow up to the earlier post today, here are the stats for buying an at the money SPY put on signals corresponding to Monday's close.  So a limit purchase of Monday's close in the April 15th expiration SPY 199 strike put would have a greater than 80% probability of reaching a profit of 80% or greater prior to expiration based upon the data going back to 1995.  There are only 28 instances.  The Kelly Bet is super high at ~67%.  Since these types of scans will never include all possible data and all history, then I always suggest reducing the actual risk from the Kelly bet amount.  One must consider draw down as well and adjust accordingly.

Click on Stats to Enlarge

The stats here show the outcome of shorting SPY at similar signals and then setting a stop loss of 4.5% and a limit gain of 4.5%.   If the limit orders aren't hit then the trade is exited in 1 month (21 trading days).  Notice again a very high win rate and a corresponding high Kelly Bet %.  In actuality, the MAX expected value would be to set an even wider limit gain and loss.  But from the results, I think this limit order makes sense for those who are using some type of leverage and don't want massive stop loss differentials from the entry price.

So the trade here would be to short SPY at ~200.00 and then set a stop at 209.00 and a limit exit at 191.00.  But exit at the close on April 8th if the orders are not filled.

Even just entering short at the current price and setting +/- 4.5% orders from here, should result in a similar risk and reward profile.  Manage the trade in the same fashion as stated above. 

The historical stats justify using maximum leverage in an equity account by 3x inverse ETFs or simply full margin (2x).

Comment here if there is any further assistance desired in managing trades regarding this information.


Pete

SPY Put Trade - 3-9-2016

Last night I ran a scan going back to late 1995 in SPY which matched some recent conditions in our market.  Scan criteria were as follows:


  • 5 day total put/call ratio in "sell" signal relative to 20 day bollinger bands
  • Daily MACD is UP
  • Daily MACD is above 0
  • SPY closes up for the day

The 1 month future returns in SPY shows about 3 times bigger max losses than max gains indicating a profitable set for short or inverse trades.

Also the stat on buying an ATM put with 1 month until expiration were outstanding.  The most profitable limit order to use was 80% from the closing price of the option on Monday.

The win rate was over 80% on the past instances.  Maybe somewhat surprisingly, the stats were not as strong when the long term moving average configuration was "down" like it is currently.  The stats were still profitable, but I would be less aggressive than the scan above suggested from the results.

So the trade here is to place a limit order to buy the April 15th expiration 199 SPY put at a limit of 4.35.  It may take a little rally back towards the highs in order to fill the order.


Pete

Monday, March 7, 2016

Brief Update on SPY and Trade Set-Ups 3-7-16

Over the weekend I ran some scans looking at historical reward and risk in SPY relative to some possible technical and sentiment backdrop data which may occur as this rally continues.

Currently the total put/call ratio is showing some complacency in the short term relative to the longer trend.  Coupled with overbought stochastics, and bearish long term moving average configuration, that stats I looked at suggested a good reward to risk opportunity would be in place for a short position or inverse ETF position in SPY.  In this case, the best reward to risk ratios seemed to occur with a 2-3 month holding period.

So this is something I am watching and will update here.  I think it would be ideal for stocks to rally further towards the 200 day moving average at which point program trades may kick in and provide some volatility to take advantage of.

Click on Chart to Enlarge

The chart here shows the total put/call ratio in a configuration I have showed many times.  The 5 day average is low relative to the bollinger bands which typically shows a market which is ready to pull back, though not necessarily immediately.

Click on the Chart to Enlarge

Also the 5 day average is low relative to the 63 day average.  And in the context of a longer term moving average downtrend in prices (50 ma< 200ma), this would seem to indicate a notable real money sentiment point which could mark the approximate top of a counter trend rally.   Again I will keep an eye on this and run some factual scans based on the data this week.


Pete

Friday, March 4, 2016

This Rally Still Appears to Have Some Room to Go - Next SPY Resistance is $204ish

McClellan Oscillator Overbought But Without Bearish Divergence
NYSE McClellan Oscillator
Click on Chart to Enlarge

The chart of the daily McClellan oscillator shows breadth hitting new peaks on recent highs.  This is strongly suggestive that the rally will make further higher highs before reversing.

So it doesn't necessarily mean that it will have a lot higher to rise, but in my observation of markets over the last decade, there almost always is a bearish divergence development in this indicator before a meaningful top occurs, even in a counter trend rally.

So, at this point I would expect the next unfilled gap down at about 204 on SPY to be tested before this rally would be likely to stall out (if  it even does stall out and lead to a major correction).

I will run some scans over the next week to help quantify the risk reward of potentially shorting or speculating on resumption of a larger downside in the upcoming days.  But I would not jump the gun here as far as speculating on the downside.  Let it play out.  Let some divergences develop and let the sentiment and breadth show in definite terms that a typical topping type action is occurring.

I will update as it unfolds.


Pete

Wednesday, March 2, 2016

Stock Are Nearing Overhead Resistance - Possible Shorting Point Upcoming

As I have outlined in some previous posts, SPY seemed likely to rally into the 199-204 zone as overhead resistance up from the support zone around 185.  SPY is currently just getting close to that zone which includes multiple unfilled gap downs.

The weekly stochastics is still just perking up from a pretty oversold condition, so the current rally could have some more time to go.  However price has already regained the 50 day moving average on SPY and the 200 day moving average is currently sitting at about 202.50 and likely falling in coming days.

So the program trading systems may kick into selling mode as price moves up into the unfilled gaps and longer term moving averages are tested from the underside.

I will be watching real money sentiment and intermediate term divergences very closely in coming days and weeks to help determine the possibility of continued market strength, as well as profitable shorting or put option speculation points.


Pete