The last couple sessions have showed what I call a total put/call ratio sell warning. I have shown the chart many times, but the 5 period total p/c ratio is below the 1 standard deviation bollinger band.
I added several other concurrent filters to the data, and they basically all suggest a negative skew over the next couple months. It appears most strong looking out about 2 months.
I also looked at time only in December when the signal occurred. It was less bearish compared to the total sample. The skew still went negative at the 1 month mark, but was positive for a couple weeks after the signal. That would fit our current situation where we have no bearish divergence in daily MACD, and Christmas is yet ahead of us and the seasonality is still positive.
I also looked at the signal in December when the weekly MACD was above 0 versus when it was below 0, meaning the market was recently selling off. When the signal occurred above 0, as it is currently, it was more bearish, but not many instances were present.
The FOMC meeting announcement will be tomorrow. I think it possible that markets sell off a bit, but then still end up making more new highs.
In any case from my perspective here, I dont anticipate much further price gains in SPY for the next couple months. Some of the stats that have showed up on the back tests are compelling for an inverse position being established here. From the option standpoint there are profitable plays as well on the puts, but my personal assessment of the market position is that it will likely be a couple weeks or so until markets are ready to top or start to roll over.
Pete
Tuesday, December 13, 2016
Monday, November 28, 2016
Currently Near Probable Momentum Peak In Stocks
As of today in SPY, the 14 period Money Flow Index turned down from above 85. Also, the daily lower bollinger band turned up after an expanding move in the recent run up. Both of those signs are typical of the end of the main trending part of a market move.
From my perspective it seems most likely that stocks will retreat slightly or chop around but still end up pushing to higher highs in coming weeks.
Currently the SPY etf is setting up for a major multiple time frame bearish divergence. Both monthly and weekly MACD signals are in a bearish divergence at the recent highs. The daily MACD has not matured to a bearish divergence yet. The better set up for a possible intermediate top area would be for a mild decline in SPY, followed by a move to new highs with a daily time frame MACD bearish divergence. The daily weekly/combo of bearish divergence readings in itself has had a forward negative skew in SPY, though not a huge one.
Seasonally stocks have historically tended to hold up into the Christmas/New Year's time frame. It doesn't seem to me to be a solid bet against the uptrend at this time. But the recent upwards move seems to be mostly out of steam for the short term. I do not see any reason to bet on further advances unless there is a compelling short term sell off which occurs over the near term.
Pete
Wednesday, November 9, 2016
Still Expecting Some Volatile Chop Ahead For Stocks
Today (including last night futures trading) was a unique event for sure. I really don't know if backtests are that meaningful on this situation.
My feeling is that despite that big drop in implied volatility, there will still be choppy/volatile type trade in coming days.
For instance here a look at forward MAX gains and losses across time frames following a day where the VIX drops more than 20%.

There were only 10 instances going back 21 years. But see that there were some big decliners to follow. The skew was quite negative. I had showed the stats on the VIX being down more than 15% in a post a couple days ago. It showed that about 2/3 of the time prices closed lower 7 trading days later. Well in the VIX down more than 20% scan here, the average closing price 8 days later was down nearly 3%. That was helped down by a couple big instances in October 2008 which were in the thick of the most volatile time in history.
Anyway, the reasons for very high volatility and erratic moves in the VIX may be varied. But on average there were some choppy situations ahead. And based on the averages and MAX loss values on a closing basis following these signals, it would suggest that prices could trade lower into late next week.
I am not making any further buys or sells at this point.
Pete
My feeling is that despite that big drop in implied volatility, there will still be choppy/volatile type trade in coming days.
For instance here a look at forward MAX gains and losses across time frames following a day where the VIX drops more than 20%.

Click on Chart to Enlarge
Anyway, the reasons for very high volatility and erratic moves in the VIX may be varied. But on average there were some choppy situations ahead. And based on the averages and MAX loss values on a closing basis following these signals, it would suggest that prices could trade lower into late next week.
I am not making any further buys or sells at this point.
Pete
Tuesday, November 8, 2016
Implications of Persistently Elevated VIX/VXV Ratio 11-8-16

Click on Stats to Enlarge
The VIX is a measure of implied volatility in options with an expiration of about 30 days. And I have discussed the VIX in relation to the VXV many times on this blog. The VXV is a measure of implied volatility in options with about 90 days to expiration.
When the shorter term VIX is above the longer term VXV, there is a theoretical imbalance occurring. This indicates "fear" or increased demand for options which are used as a hedge. So we see the ratio spike on sell offs in the markets.
Currently the VIX/VXV ratio is on its 4th day in a row above 1.0. The VXV has limited history only going back to about 2010. So we don't have a lot of data and information from prior bear markets to assess this ratio in downtrending markets. But there have only been a few periods where the ratio has stayed elevated above 1.0 for a significant stretch over many days or even a few weeks.
Also, of note yesterday and today is that we are seeing a large rebound in stocks, with a big drop in the VIX, and yet the VIX/VXV is staying above 1.0 as of current readings this afternoon. Typically after stocks bottom and the big initial few days of rebound occur, the ratio gets back below 1.0.
So I looked at times when the VIX/VXV ratio was above 1.0 for two consecutive days where both days were UP in the SPY etf. There was a negative skew in forward looking time frames on this scan, though the instances are limited.
Then I added the further criteria that yesterday was up more than 1% in SPY (like our current situation). So yesterday was up big, and today is up again, and yet the ratio is still maintaining a reading in the "fear" zone. The results of the scan are shown in the chart above and demonstrate that over the short term, stocks were volatile and had a negative skew. Basically until the ratio drops back below 1.0, there is not an "all clear" type of return to normal signal for the markets.
So in the current situation, it makes sense that short term hedging demand is increased with the election results still ahead tonight. But don't be surprised if there are some wide gyrations in coming days or weeks, because this ratio indicates that underlying sentiment has not unwound back to normal yet.
The past area where we saw this type of behavior were after the bulk of a correction was done, but moving forward there was some wild gyrations in the process of retesting a bottom.
So I would expect to see a retest of last weeks lows in the coming week or 2.
Pete
Monday, November 7, 2016
SPY Option Trade Exit for 50% Gain
FYI, last week I had noted that I bought a 210 SPY call which expires this Wednesday based on data suggesting a very high probability of a 50% gain in the option prior to expiration. That 50% gain level was hit today and my limit order filled and the trade was exited.
And I am still holding a Nov 18th expiration 214 strike put as stated at that time as well. My goal was for the above short term option to create a brief hedge of the expected drawdown which was anticipated in this later expiration 214 strike put.
Now the stats posted earlier today are suggesting that most of the upside potential has likely unfolded in stocks, and it is reasonable that stocks could move lower allowing me to confidently maintain that 214 strike put based upon the intermediate term outlook.
Pete
My Trade Idea For This Set Up 11-7-16
Based upon the analysis provided earlier today, for my personal situation I feel the best way to make a play here is to go with a deep in-the-money put option rather than an inverse leveraged ETF. This way I can still get an option and size my position so that in the worst case scenario I lose the whole option value, it still falls at about 1/2 the Kelly bet % which the back test on this large VIX decline produces. Now with a deep in the money option and the tendency for volatility to shrink on market rises, it seems very unlikely that a 220 or higher strike put on SPY (expiring in 2-3 weeks) would be likely to lose all of its value with price rising and staying above 220 at expiration 2-3 weeks. That would take another 4% gain or with a back test that is strongly negative and the market rising into resistance at the 213-216 levels.
So I currently have an order for a 224 strike put on SPY which expires Dec 9th. Based upon some cycle analysis and time relations of recent moves up and down, I would expect price to continue to decline through November expiration or beyond. And that matches with the recent back tests I showed this morning as well as with some which showed up a few weeks back suggesting weakness for a couple months (November in this case). I am looking to enter the option at 11.00 which would take a push to basically 213 on SPY.
For those that may think that it would be better to wait until the election is done and the results are know or that there may be some big rally on the news, understand that market are constantly factoring all this into price. In past instances there were significant corresponding upcoming news in interest rates, elections, bailouts, etc, etc. And the stats are what they are.
Personally, my feeling is what outcome could be significantly unexpected (not factored into current prices) which the market would rally hard on? I don't know. But if a candidate wins that the market is not expecting, I could easily see a short term reactionary sell off.
So for me, the position sizing far out of the money, coupled with the objective past stats (which are not all encompassing, but good enough for me to make clear decisions) suggesting this type of rally is often a very short term pop, factors in the possibility of upside surprise and worst case scenario but still gives a leveraged position that can profit from what seems the most likely scenario.
Let me know if there is any question on this analysis.
Pete
Big VIX Declines In A Down Trend - A Short Trade Set Up on SPY 11-7-16
I posted recently that there was likely to be a sharp rebound in SPY based on the multiple days in a row below the lower bollinger band. We are seeing that today with SPY up nearly 2%. So the question now is really about how far the rebound is likely to go and what is the next tradable move.
Currently around noon EST today the VIX is down about 17% from last session's levels. When I backtested SPY (going back to Sept 1995) for performance following days where the VIX dropped more than 15%, the results showed negative skews looking forward all the way out to 6 months. There were 39 instances in this scan.
This means greater MAX losses on average compared to MAX gains over the time period. The skew was most negative over the first couple weeks. So this should give us some perspective that these types of big moves in the VIX are in markets that are in the midst of choppy sell offs or abrupt rebounds and possibly short covering rallies.
I went further and looked at times when the VIX dropped over 15% and also SPY gapped up more than 1% as it did today. There were 19 instances in this scan. The result was even more negative in the skew. Additionally on a CLOSING basis, all forward time frames from 1 day out to beyond 2 weeks (and even at the 1, 2, and 3 month forward times) showed negative average returns from the signal day.
What this indicates is that these rallies tended to make most of their gains off the bat, and then stocks began to decline again. Of course there were some instances where stocks continued to rally nicely. But I am referring to the averages of all instances here. The strongest negative skew looking ahead was at 2 weeks forward.
I also went ahead to look at time where the MACD (daily and weekly) were both down when the gap up and big VIX drop occurred. This left 15 instances and eliminated 4 more. This scan fits our current market where the big jump is coming right off a low as opposed to a market that has already begun to turn up or is in a consolidation.
Here again the skew is even more negative. And the peak of that negative skew is at 2 weeks forward. Closing returns are again sharply negative on average looking ahead in coming days. At 7 trading days ahead, 11 out of the 15 instances closed negative relative to the signal day.
Now in looking at past instances most of these situations were pretty choppy. This makes the option play of buying puts less ideal. But the expected values in shorting the stock or using an inverse ETF appear to be very good on average.
The best play from my perspective appears to be to short SPY (or buy inverse ETF) with a paired limit exit gain of 9.25% or even 15% and then a stop loss of a corresponding amount. Obviously it would be almost incomprehensible for a 10% gain SPY over the next couple weeks. But as a simple strategy that allows for an expected value of around 3% on shorting SPY. This would equate to closer to 10% expected value on a 3x inverse ETF like SPXU.
From my current perspective it seems that I would want to be short before the election results came out if stocks hold up into tomorrow. Based on these results I will determine a strategy to enter an inverse position. Possibly enter half a short position today at the close, and then wait to enter a second half position based on future action or an actual short term technical topping signal like a 15 minute MACD divergence.
Pete
Thursday, November 3, 2016
Continued Possible Bullish Set Ups For Stocks 11-3-16
While there is still time in today's session, and it looks to me like price could rally this afternoon, I wanted to get some info out because of the situation.
If prices close below the lower bollinger band today it will be 3 in a row. This is a bullish set up. Other factors currently in play, low stochastics, low MFI reading, multiple closes below the open in a row all increase the bullishness on back tests.
About half of the past instances where prices closed 3 days in a row below the lower bollinger band, it went on to close below it for the forth day in row the following day. 4 closes below the lower band in a row is a massively bullish set up on the back test. And over the following 3 days the MAX gain is nearly 4 times as big as the MAX loss in SPY.
So the point here is that IF we close below the lower band again today in SPY, there is a nice set up based on past data. And even it goes on another day or so, the snap backs in the past have been sharp, and may still end up being a profitable end result.
The play would be to buy the ATM SPY call option which expires next Friday. There are a range of limit order with high probability of success and strong expected value. 80-130% limit orders are the right range.
For specifically 3 closes below the band in a row, the peak closing return on SPY has been 5 days later base on the past instances. The average was about 1.5% gain (including losers).
Pete
Wednesday, November 2, 2016
Bullish Short Term Option Trade 11-2-16
As mentioned earlier today, my outlook is still intermediate term bearish on stocks, and several of the studies I have ran over the last few weeks support that outlook.
However, today's price action significantly shifted the skew toward the bullish side for the short term - basically 1 week out. So I ran a number of different scans looking at price and real money sentiment measures I track, and the balance was somewhere from mildly to markedly bullish for the next week or so.
A couple factors which seemed technically significant center around bollinger bands and the number of closes below the open in a row. There are 5 closes in a row below the open for SPY and 7 in a row for the Nasdaq 100.
I ran a scan with the following criteria on SPY:
- Gap down
- Close below the open
- Open below the lower bollinger band
- 2 closes in a row below the lower bollinger band
So this scan criteria was met today/Wednesday. There were only 19 instances going back 21 years in SPY. Out of the 19, 15 of them made a maximum gain of 1.4% or more over the coming 5 trading days. So that would be about 3 points in the SPY etf currently. 14 out of the 19 closed higher 3 trading days later. The average of all 19 instances showed a 1.79% gain at the close 3 days later which was the peak average closing return over the next few weeks.
Now as of the closing values SPY did not officially open below the bollinger band. It was a few cents above. But the idea is that this is strong downside trading which has led to reactionary rallies in the past.
I also ran a scan which occurred today where:
- SPY closed below the open 5 days in a row (not more or less)
- SPY closed below the lower bollinger band
There were only 12 instances going back 21 years. 11 out of the 12 made option gains of 50% or more if buying a 1 week until expiration ATM call on the close of the trigger day/today. The average closing gains at 6 and 8 days ahead were over 2.5%.
So these kind of lopsided bullish studies indicate that SPY could very well put in a little rally here. I did look at other indicator combination that were not so lopsidedly bullish, but in general the backtests and technical picture indicates the upside gains over the next week are likely to be more than the downside risk.
I would guess stocks will chop or rally a bit prior to the election day next week.
Considering the overall context, I would be looking for a bearish set up by next week if the markets do rally a bit.
I also exited my SPXU position near the close today for about a 5% gain.
So today near the close I made a purchase of a 210 SPY call option which expires next Wednesday. I have a 50% limit gain order GTC to exit or it will likely expire worthless.
I also am still holding a Nov 18th expiration 214 SPY put. It has some small gains currently, And I plan to hold until expiration or 100% gain.
Pete
Stock Market Update 11-2-16
US stock indexes made a "crack" yesterday with the SP500 and Dow30 breaking the recent October lows. I had made a post recently which looked at past similar breaks to new lows after a rally attempt. The take home from that was not a super high probability of a decline, but there was a downside skew which is pretty strong for about 2 weeks, and even longer.
So we are in a situation where stocks are likely shorter term "oversold" and likely to bounce as a small battle occurs around this minor support from the Sept and Oct lows. But the intermediate term and upcoming events could still provide significant selling interest for several weeks.
I have run several scans looking at the current mix of technical indicators and sentiment, and some have showed a significant bullish skew, most notable for about a week.
I also ran a scan which looked at a combination of marked increase in volume, VIX, and total put/call ratio all on the same day. And while it may seem like a big swell in these sentiment measures would create a nice bullish set up, the results actually showed a significant negative skew for a week or so. Basically, it would be better for a bullish set up to see the market "slow down" rather than trying to catch the falling knife while it is still picking up speed.
So my personal interpretation and opinion of the most likely scenario is for a brief rally attempt beginning soon, but then likely resumed sell off and lower lows over the coming 2-5 weeks.
The FOMC meeting announcement is this afternoon, and so there is the possibility of a reactionary move in the markets this afternoon. Given that stocks have sold off over the last week, I would expect that there may be some "buy the news" activity after the announcement. But I would not be really surprised to see continued acceleration of the recent sell off either. That would seem ideal to set up a probable bullish short term opportunity in the coming days.
Pete
Monday, October 31, 2016
What Is Likely To Happen Next For Stocks? A Thought Experiment Suggests A Rapid 5-10% Move (Probably Down)
I have run a few backtests comparing market conditions on the close last week against past data. On the balance I would have to say that the short term (1-2 weeks) forward expected return is neutral based on the combination of criteria I looked at.
Now that is just going off of past data. In actuality there seems to be very little chance that the actual returns will be neutral or muted. The Dow 30 has coiled sideways in a narrow range for 2 months straight, which is very unusual. It seems obvious that markets are awaiting further information to be generated before moving directionally.
One of the basic ideas related to market movements is that long basing periods represent pent up buying or selling supply and demand. And so once the range or base is broken, there can be a significant price movement.
So I ran a little though experiment, with the Dow's current tight price action in mind.....
Historically, in the SP500 a typical "leg up" (without a 1 month high to low correction) has lasted about 4.5 months or a little over 90 trading days. And a typical gain in a leg up has been about 25% for the SP500 average. So there are obviously some up and some down days even in a trend, but the average close up would be roughly 0.25% for the duration of the trend based on these numbers. (That includes the down days). And a typical leg down would show even a little greater magnitude average LOSS per day.
So here we are with the stock averages just moving sideways for 1-2 months. Let's say there is actually 1-2 months up pent up buying or selling at 0.25% per day. Just 21 trading days of average 0.25% gain per day is 5.25%. So what I am getting at here, is that stocks could rapidly move 5-10% once the new trend or reactionary phase begins after this flat, tight base completes.
Now based on price patterns and cycles, I feel the likely outcome will be for a market sell off to occur in the wake of this tight range. But don't be surprised to see a rapid price change over a few weeks time based upon the pent up supply or demand.
Pete
Tuesday, October 25, 2016
Short Term Market Action Suggests to Me That Stocks Will Fall Starting Late This Week or Next

Click on Chart to Enlarge
This chart is an hourly chart of SPY. What we are seeing here is an obvious overlapping type short term action, not a directional upward movement that would signify major buying interest.
Notice that the overlap has occurred underneath 2 trend lines, one from the consolidation beginning in September. The other origin is not shown, but is a trend line from Feb 2016 lows to the June 2016 lows.
Also interesting is that the 214.50 level is level that SPY was trading at just prior to the last FOMC meeting announcement. It had been support for the triangular consolidation in September. Now prices have met some mild selling each of the last 4 times price attempted to reach that level.
The next FOMC meeting is next week. And so we could possibly see some market movements with higher volatility next week.
Currently I am positioned in 3x leverage (SPXU) at ~24.00. Also, the banking sector stocks and brokerages have hit the extreme end of their harmonic reversal zones and it looks like today could have been the final day up in that major rally in big banks.
Based on what I have posted here in recent weeks, as well as the larger prices pattern and cycles, it seems likely to me that a substantial move down is imminent.
But we shall see.
Pete
Monday, October 24, 2016
Current Market Action Still Seems To Show Greater Downside Risk Than Upside Potential Here
Over the past few market sessions I have back tested a number of different combinations of market conditions which are currently, and I am not seeing much in the way of forward bullish skews to the data. Most everything I have ran which matched current market conditions were neutral or slightly bullish short term. But there are a few studies which have shown consistent skews to the bearish side which are significant. So my take away is that, stocks could break lower in coming weeks after this chop ends.
I don't have any insight into how the market will behave from now into the election time when considering the singular effect of the election.
One scan I looked at today is the following conditions:
I don't have any insight into how the market will behave from now into the election time when considering the singular effect of the election.
One scan I looked at today is the following conditions:
- total put/call ratio < 1.0 today
- 5/63 day total p/c ratio less than 1.0
- VIX high less than 13.5 today
- VIX closes lower today
- VIX/VXV ratio is < 0.85 today
- SPY gapped up today
So basically we have a low VIX environment (which may be a contrarian signal, but not necessarily a timely one) where sentiment based on the put/call ratios has been toward the complacent side of average recently, and SPY is gapping up.
These occurrences can occur in clusters, and so I removed any redundant days after the initial day in a cluster, unless they were more than a week apart. And the results were that all the time frames I compare from 3 days out to 2 months, showed a 2-3 times greater MAX loss versus MAX gain from the signal day (today).
Let me briefly say, that there are not many "random" scans that show such a lopsided skew to the downside in stocks. Since stocks spend so much more time generally rising than declining, when we see these types of imbalances in forward returns to the downside, I typically take it as more significant that stocks are at risk of declining.
Volatility rises when stocks decline, and so a significant price decline may occur rapidly in comparison to the steadier trending which may occur in an upside move of the same amount. Part of my point here is that I have found it far less easy to find scannable market conditions which consistently demonstrate impending market declines. What we more often see are windows with a skew to the downside, but with less precise ability to pinpoint "the top" in comparison to pinpoint a bottom where prices are likely to rebound.
And currently for the last roughly 3 weeks some scans have shown that looking out a couple months (or more) there is risk of downside. So it may end up that most of the trade is choppy but then there is a week or so with a big price break where the losses really show up.
What I am choosing to do here is to get positioned in inverse ETFs with a time horizon of 2 months out as the "time expiration" on the trade. From some other cyclical type analysis that I follow, it seems most likely that the downside would occur in November, or into December, assuming we do get a sell off of significance.
Pete
Friday, October 14, 2016
No Clear Directional Bias Currently Based on My Backtests in SPY
Yesterday and today I have looked a several scans investigating MACD position, stochastics, bollinger bands, 3 month low reversal attempts, real money sentiment measures, and the balance I would have to say is mildly bearish looking forward a couple months from yesterday's close in terms of MAX losses versus MAX gains.
Basically it seems the the intermediate term of the next couple weeks or possibly longer has some downside currents. So real short term or swing style trading may be best on selling rallies.
It would be nice to see more of a hard sell off in order to set up a bullish rebound attempt. The best trades I ever see in my scans are bullish set ups after hard sell offs. Even in down trends there are often sharp rebounds for a few days, and the weekly options offer attractive opportunities, and the upside skew can be very nice for ETF plays with wide stops and limits.
Pete
What If SPY Breaks to New Corrective Lows From Here? 10-14-16 Stock Market Update
Click on Chart to Enlarge
First let me immediately state that this study is NOT currently active. It is a "what if" scenario. What if SPY ends up breaking this Thursday's low with a weak close in the bottom half of the range?
That would be a reversal failure type scenario because yesterday price broke to a 3 month low, and reversed to close above it. So basically I am posing the question of what happens if a reversal attempt from a low (with bullish divergence in sentiment) fails to form a low which holds.
What the table demonstrates is that a break to new lows would suggest a bearish skew looking forward based upon historical comparisons from the last 21 years of SPY history.
The skew is pretty strong out to 2 months later, with greater MAX declines on average than MAX gains. Looking at the 2 week forward time frame, there have been some significant declines following these breaks. If trading the options, the maximum expected value play for my system involving at the money options, would be to buy an ATM put with 2 weeks until expiration, and set a limit order gain of 200% to exit the trade. The win rate on the past instances was only 44% and the Kelly Bet was low at about 15%. So it would justify only a smaller position but the expected value was strong at ~32%.
What about the equity side of things? Well first off there is a difference between just shorting on a stop order to new lows versus letting the break to new lows happen and then waiting to see if prices are able to again reverse higher. The backtesting suggests a stronger downside skew if prices break to new lows AND close in the lower half of the range. So that is the scenario the above stats are for, and what the strategy would be here on the ETF side.
Based upon my system and backtests, if we entered short SPY at the close of a failure day as discussed in the above paragraph, and set a stop order 7.75% above prices in SPY, and a limit gain order 7.75% below prices, but exited at the close 9 trading days later if the orders weren't hit, it would produce a nice 2.36% expected value. That is using SPY unleveraged. The back test stats justify 3x leverage on the short side in this case though. And the win rate was 64% on the past 25 instances.
So we could expect about a 7% gain on average using the 3x short ETF like SPXU or SPXS.
That is a very nice set-up for profiting quickly in a down market.
So if there are questions on this let me know. But if you use alerts, you could set an alert on SPY if price moves to 211.20 or lower to make sure you understand that price is breaking to new lows and this set-up will be in play if the day's close is weak (below the mid point of the day's range).
Pete
Thursday, October 13, 2016
Another Small Sample Study Showing Potential For Sizeable Sell Off - 10-13-16

Click on Chart to Enlarge
Today as of the open, SPY is opening below the lower bollinger band. With no other filters, this is a neutral occurrence in terms of forward returns based upon backtesting.
Adding a stochastics fast line to be below 20 still shows a pretty neutral forward skew of max gains vs losses.
But the table above adds just one filtering criteria which is that the previous day closed UP. In our current case SPY made a small close up yesterday and closed above the bollinger band. Now today we are seeing an oversized gap relative to the range in order for it to open below the lower bollinger band.
In the past instances, the table demonstrates another significant skew to the downside in the short term. In this case, as with the study on MACD and stochastics crossing down on the same day, we see some pretty sizable short term sell offs beyond random MAX draw downs.
Now most of the losses occurred in the first 3 days proportionally. So, I am just making further noted here that we could see a swift decline. But that decline would very likely produce some back test studies which offer bullish trade opportunities.
Again this is a smaller study, and stocks certainly could rally right fro mthe open, but be aware of the context here and possibility for sell off.
Pete
Tuesday, October 11, 2016
Another Small Sample Bearish Study Triggering Today
I ran a scan which looked at
- daily 14,3 stochastics crosses down from above 50
- weekly MACD is down
- daily MACD is down
The results showed 20 instances going back to Sept 1995. The MAX loss was 4 times as large as the MAX gain over the next 2 weeks. This signal is occurring today.
When I added the conditions of the daily MACD line being below 0, the results were also very bearish. And when I added the additional condition of today being a cross down on the daily MACD (from below 0 still) there were only 4 instances going back the 21 years.
Dates were
8/27/1998 - ~9.5% loss within 3 days
10/4/2005 - ~2.5% loss within 3 days
8/19/2015 - ~12.5% loss within 3 days
9/26/16 - sideways trade for 2 weeks
So check these on your chart. The most recent one 2 weeks ago led to nothing of significance. Just a historically unusual sideways pattern.
But the other 3 had massive skews to the bearish side. About 10:1 skew to the downside over the next 2 weeks.
I know it is small sample size. But may be of note.
Some other studies looking at volume increases and price declines similar to today show a mild to moderated bullish picture for 1-2 weeks on average.
So it seems like the most probable scenario is a modest rebound over the next 1-2 weeks back up into the range we've been in. But there may be a greater than typical risk for a quick sell off of large scale.
I will keep this under watch and post if there is relevant info to follow.
Pete
Investment Banks Look Like They Will Sell Off Hard In Coming Months - 10-11-16

Click on Chart to Enlarge
This chart is Bank of America, BAC and is a weekly chart with the stochastics visible beneath. Here we have basically a picture perfect pattern formation of a major top reversal.
A few points of observation:
- Notice the decline off the 2015 highs created a larger (and faster rate of decline) decline than any pullback during the bullish run since 2011. This creates what Gann referred to as an overbalancing after the end of a price trend.
- The broad market indices like SP500 and Nasdaq have made new all time highs in 2016, but see that BAC has not rallied back to new all time highs. I call this a non-confirmation of the broad market trend and implies future weakness in the stock.
- The rally since the lows in the winter, has taken longer to form than the preceding decline, both from the all time highs, and the secondary lower top in Nov 2015. This price action implies a new downward trend in that the larger and faster moves are in the downward direction. the explosive, higher rate of change moves have been to the downside.

Click on Chart to Enlarge
This chart is a daily chart of BAC, so it is zoomed in some. Further observations....
- Notice the overlapping nature of the move up since February. Boundary lines for the move up since February would form a rising wedge type pattern.
- The rally is now peaking in an area of prior price congestion and multiple gaps downs from the winter decline. This could be a chart/price based overhead resistance zone.
- The MACD on this chart shows a major bearish divergence with price at the price peak yesterday. This divergence at a lower high (than the beginning of the prior declining move) implies exhaustion and completion of a price move at a lower high, again indicating a downtrend likely to continue.
- The recent poke to new highs and reversal below the old high, creates a mini failed breakout or double top, which may be a final smart money selling point as they sell into the break to new highs and attempt to unload right at the top.
From this point, a high quality top reversal pattern would be unlikely to make any further advance. If a major price decline is to unfold, it would be ideal or not uncommon for price to gap down through the rising red trend line of the recent leg up since this summer bottom.
Assuming there is a sharp break of the red trend line, it would be quite common for price to rally up to very near the price level where it broke the trend line. That would often occur with a daily stochastics rally to above the 50 mark. And the most common short term reversal candlestick to occur at that backtest point on the chart would be a bearish engulfing pattern based upon my observations.
This quality of pattern will likely retrace back to at least the mid point of the recent rise. It would take a major correction or bear market environment to fulfill a complete retracement of the rally since February. But given the current position of the broad stock indices, the bull market could be topping here.
Similar comments apply to charts of SCHW, MS, AMTD, ETFC, CFG, C.
This will be interesting to observe in context of the upcoming US election, and a potential reversal of the long period of no interest rate increases by the Federal Reserve. The next FOMC meeting and announcement of interest rate changes is November 2nd. Election day is the following week on the 8th.
So it will be interesting to see if the Fed goes ahead and makes the rate change at the upcoming meeting just prior to the election. But if not possibly wait and make the change either after the election or after inauguration.
From the observation of these price patterns on major national financials, it seems like the time for an "event" catalyst to bring the next major wave down.
Pete
Thursday, September 29, 2016
MACD Whipsaw This Week - BackTest Results
The daily MACD this week made a couple whipsaw crosses. It crossed up on Friday, then down on Monday, then up again on Tuesday. This type of cross in one direction followed the next day by a cross in the other direction is not very common.
Going back to 1995 in SPY I only found 4 instances where there was an up/down/up pattern on three consecutive days. The back test results did not seem significant. No major skew in the forward returns, and small sample size.
When I look at just the down/up pattern on back to back days, I found 21 prior instances before this week. In this case there was a definite bearish skew, with some large decliners in there, and the forward return showed a bearish skew with the forward MAX loss being over twice the size of the MAX gain at time frames from 3 days out to 1 month.
When I filtered the results for the occurrences where the MACD line was below 0, the results were even more bearish (this condition matches the current market) but with only 8 instances. Only 1 out of the 8 had MAX losses less than 3% in the following month.

When I filtered for the weekly MACD being in a down position instead of the daily being below 0, the results were roughly similar with a pronounced bearish skew.
So, the first couple days since the signal in the last post, have not been typical of the strong negative skew suggested by that small sample size study. But here again we see a piggy back study with a strong bearish skew, but small sample size.
Anything can happen, but I currently see no really great reason to abandon the previous trade currently.
As a side note, when I reversed the signal order for the whipsaw to up/down on consecutive days, there were only 13 prior instances, and the results were shorter term bearish, but more positive looking forward several months.
My take away here is still to favor the downside for upcoming weeks.
Pete
Monday, September 26, 2016
New Put Option Trade - Stocks Could Decline Dramatically The Next 1-2 Weeks

Click on Table to Enlarge
The table here shows the results of the following back test criteria:
- daily MACD crosses down today
- daily 14,3 stochastics crosses down today from above 50
- weekly MACD is in the down position (fast line below slow line)
Four trading days later all 8 instances closes lower. The minimum was 0.5% and the maximum was over 10%. But looking at the MAX gains versus loss over the coming days and weeks, I rarely see anything this strong.
The instances are not that high, but I don't think that means this sample is insignificant. Some studies are rare, with small sample size, but are obviously notable events.
I purchased both a 214 strike Nov 18th expiration put as well as a 214 strike Oct 7th expiration put. Based on the stats, this Friday's expiration certainly could be used as well. The stats are about par with the 2 week stats as far as option % returns expected.
In this case, the past instances suggest a limit order of 160% gain on the put option would produce a very high expected value and win rate. While the sample size is small, I am going ahead and placing that limit order.
I am going to wait for a couple days before placing the limit order for the Nov put. I think the 199 level on SPY could be broken by November.
Trade Idea:
Buy the SPY Oct 7th expiration 213 strike put at the open tomorrow.
Additionally, a short/inverse trade could be entered here. Using a 7.75% limit gain order and stop loss order (can enter as an OCO if available), would produce the maximum expected value based on the past test.
Pete
Very Bearish Set Ups Today - FYI
I have spent some considerable time today and over the weekend looking some back tests which have some similar characteristics as the current market environment.
Without going into all the different angles, if today closes below the open, the technical set up seems to be moving into a strong wave to the downside.
It is possible that today there will be a cross down in the daily stochastics, and the daily MACD, with both the weekly stochastics and weekly MACD in a down position. This has been very bearish in the short term over the past 20 years. Possibly when several different technical systems trigger a sell signal on the same day, there creates the possibility for some sharp short term follow through to the downside.
I will exit my UPRO trade today by the close if the close is below the open, and possibly even if it closes above the open. The 3 day forward returns are so sharply bearish in what I have looked at, that I will make a discretionary exit based upon the new information.
Also, the put option from 1 week, all the way out to 2 months have some favorable outlooks based on the back tests. The most simple play seems to be buying an ATM put with either 2 weeks or 2 months (or a mix of both) until expiration, and just waiting until expiration to exit.
I will make some final assessments by about 3:00 pm today and possibly post a specific trade recommendation.
Pete
Thursday, September 22, 2016
Update on UPRO and SPY Equity Trade 9-22-16
I recently made a post regarding a bullish ETF trade on UPRO or SPY with the trade stats suggesting an exit at the close of 9/21/16. That exit came yesterday and was a profitable exit.
However I personally did not exit the position because of new scans suggesting further upside probability. I looked at a few different angle of the market action, but 1 scan that looked at:
However I personally did not exit the position because of new scans suggesting further upside probability. I looked at a few different angle of the market action, but 1 scan that looked at:
- 3 closes below the open in a row
- with the daily fast stochastics below 30
- and the yearly moving average of price pointing up
This produced a forward MAX gain in the next week that was over twice as large as the MAX loss. There was a highly profitable play of closing the trade 5 days later (in this case at the close of next Tuesday Sept 27th).
So I have kept the same stop and limit sell orders that I originally had placed, but did not close the trade yet.
I show this as an example of using new market information to adjust trade strategy on the equity side where there is no expiration.
For instance, a certain scan may have a nice forward return on average, but when you look at trades that move sharply in the new expected direction in the first few days, they may have a very profitable forward expected return over the next few weeks or months based upon the back test. So in these cases, it would make sense to use the newly generated back test information to adjust stops, and continue to hold longer for larger probable gains as a leg up or down appears likely to continue.
If you knew you were in the midst of a probable trending move, there would be no desire to exit. But you never know. You have the past information as probabilities, and go with what it suggests.
Pete
Longer Term Pattern Analysis on SPY ETF - A Major Top Possibly Forming 9-22-16
 |
| SPY ETF is Forming a Possible 5th Wave Up and Creating Longer Term Bearish Divergence |
From a charting standpoint, the suggested price move in that time frame would lead to a break above the upper channel line of the April to August highs. And from a technical analysis perspective it could make a massive multiple time frame bearish divergence in the MACD - monthly, weekly, and daily all in bearish divergence. I have learned that those set ups are significant. Even if a major top does not end up forming, I would guess there will be a significant correction after such a set up.
From a smart money perspective, we have seen the smart money become aggressive sellers since the move to new highs in July. Price has not made much headway since then. If we continue to see increased smart money selling as prices push higher, and price then breaks below the September low, that would be suggestive that the bearish forces have won this battle.
However, when large short positions are accumulated by the smart money, and the opposing players are able to push price several percent above the valuation/battle zone, it may force a short covering by the smart money. That scenario can lead to major price gains in the market, and often in pretty steady fashion.
But then the scenario is that once the short covering is complete, the stage would be ripe for a major top. I highlighted such a scenario in 2011 in the cotton market. Given the large potential "basing period" since May 2015, a short covering rally could take the market much higher. So I am not hanging my hat on one outcome.
Any short attempted at a quality set up would need a defined stop loss to protect against such a scenario.
But for now, my expectation is that prices will trend higher for the next week or two before another short/inverse set ups "ripens".
Pete
SPY Option Trade Exited for 50% Gain -
In follow up to the last post and recommended option trade for SPY calls, the profit target has been met and limit order filled for all of the different expirations which fell in line with the recommendation and past data.
The 50% limit order for expiration last Friday, this Wednesday, and this Friday have all been reached, so the trade is closed for another nice short term gain.
Currently, I expect SPY to move to new all time highs again, probably by the end of this month. However, the pattern that I see, I feel could signal a major decline to follow. I will give a perspective on the set up to follow for a possible longer term high with practical idea of timing a short/inverse trade on stocks as the set up develops.
Pete
Wednesday, September 14, 2016
New High Probability Call Option Trade on SPY 9-14-16
As of the close of Tuesday/yesterday's session, another high probability call option set has occurred.
I ran a scan with the following criteria:

I ran a scan with the following criteria:
- SPY gaps down between 0 and -1.0%
- SPY closes down more than 1%
- The %K 14 period stochastic is below 30
- 63 day MA is greater than 252 MA (bull market configuration)
So we have a gap down and lower close with the stochastics near oversold in moving average up trend.
There were 80 instances, the results in the table below.

The trade strategy would be to buy an ATM SPY option at the close of Tuesday or the equivalent price. Then set a limit order of 50% gain to exit the trade. Let it expire worthless if the limit is not hit.
Now the dilemma here based on my option analysis system is that we are at Wednesday, and the stats are for buying an option with 5 days until expiration. But we don't have that ability. We could either buy this Friday's expiration or next Friday's. I would suggest getting more time rather than less because the stats are still strong for 10 days until expiration. However, the skew is still very strong for the first 3 days in favor of upside gains. So either way could be justified.
Pete
Tuesday, September 13, 2016
New SPY/UPRO Trade
Based on the flip flop reversal pattern which occurred in SPY over the last couple days, there is a bullish trade opportunity based on the past similar occurrences.
I scanned SPY for
I scanned SPY for
- yesterday down more than 2%
- today gapped down
- today closed up more than 1%
18 occurrences came up, and the average close 7 days later was about 2.5% higher in SPY. Now these stats are relative to Monday's close. But early tuesday is down, and so the reward to risk may be even a bit higher which is good.
Now in this instance, I also see a qualitative pattern suggesting to me that SPY may make another move to new highs in the coming few weeks. It would not surprise me if that ended the bull market though.
In this case I would suggest using a 5.5% limit sell order after entry on SPY, and a 5.5% stop loss order. This can be entered as an OCO order if you can. Exit the trade at the close of 9/21 if the limits are not hit.
Most of the past instances occurred in bear markets where volatility was higher. But the few that occurred in bull markets still showed a nice positive expectation.
Pete
Monday, September 12, 2016
SPY Option Trade Exited for 50% Gain
If entered using a limit order of 1.74 for the 213 SPY call option expiring this week, and using the 50% limit exit order which stats showed has had ~90% win rate on past similar tests, the trade is already exited in today's session for another nice play.
I took a partial position on that order this morning when my limit order of 1.20 did not fill shortly after the open. SPY would have had to trade about 50 cents lower this morning for it to fill.
This shows what can be a pitfall of trying to get too perfect on certain trades. The simplest play in this case would have been to buy right at the open as the gap down was indicated. And the stats were so outstanding that there was not great reason not to.
In any case, for now if you have not entered (and exited) the trade ideas I posted, I suggest standing aside and let things further unfold.
Pete
Implications are Strong For a Gap Fill This Morning If Price Gaps Down
Futures in the SP500 have been lower since last night, and so I ran some back tests this morning looking at times when a 2% down day was followed by a gap down.
I looked at it with different filtering, but the results were consistent. One of the ways I looked at it is to test and see if price gapped down less than 1%, would the gap be likely to fill? Looking back at the history of the SPY etf there were 58 instances where the 2% down day was followed by a gap down in the range of 1% or less. Out of those there were only 5 which did not completely fill the gap and trade back above the previous day's close.
When I filtered the results to look only at instances with a rising yearly average, the results showed 21 instances, all of which completely filled the gap down. Also in these instances, the average close 5 days ahead (this Friday in this case) was 1.24% higher from the open (of today/ day 1).
Given the studies I looked at yesterday being so consistent, and a fair possibility (~50%) of a MAX intraday gain of 1% or more from today's open, I am going to purchase the SPY 213 call option expiring this Friday, with a limit order of 1.20. It would take a move down to roughly the 212 level on SPY to fill the order. Then I will set a limit order of 100% gain for exit of the trade.
Pete
Sunday, September 11, 2016
SPY is Likely to Fall a Bit More Then Rebound Sharply for 1-2 Weeks - New Option Trade
The previous recommended SPY put option trade was exited on Friday for 100% gain which was the suggested limit order for the trade based on the backtests.
Friday was a notable day with a very strong sell off and close low in the range and huge volume increase. The VIX swelled over 30%. The total put/call ratio increased more than 20%.
The increases in the VIX and total put/call ratio themselves are not particularly bullish. From the tests I ran, it seems to be neutral for the near term, but the risk for oversized sell offs is increased for the intermediate term looking out a couple months or more.
However, the price and volume pattern itself, is showing notable bullish skews over the next week.
A scan I ran had the following criteria:
- SPY down 2% or more
- SPY gaps down
- SPY closes in the bottom 10% of the day's range
Going back o Sept 1995, there were 112 instances, which is a nice sample size. And over the following week, 91% of those instances, showed gains in ATM call options of 50% or more.
This is a very high win rate...outstanding consistency.
So the play here would be to purchase a SPY 213 call option which expires this coming Friday, Sept. 16th. Then set a limit order of 50% for exit. I would use a limit of Friday's closing value in the option for entry. The closing value was ~1.74.
Another strategy would be to set a limit order to buy the same option at 1.30, and then set a 100% limit order to exit the trade. This is based on the fact that there is a greater than 60% chance that tomorrow will have a lower low at least 0.5% below Friday's close.
When filtering for bull or bear markets or MACD configuration, the results were not significantly different.
If tomorrow SPY gaps up, then based on the past similar occurrences, 2/3 of the time, price will decline back to the level of the previous day's close or lower - filling the gap. I say this in case tomorrow gaps up, it would then be sensible to place the limit order at 1.74, and use the 50% limit exit order.
I may update on the set up again in the morning as I see the futures position and probable gap direction and size.
Pete
Friday, September 9, 2016
SPY Trade Update
Regarding the recent SPY trade I outlined, when I provided the information I stated that exiting after 7 days was the highest expected value on the backtest. I did not take into account Labor Day market closure when suggesting exiting at the close today/Friday. So the 7th day would actually be this coming Monday's close.
Currently, the decline appears to have quite a bit of downside strength and has not yet had bullish divergences on any time frame 15 minutes or above. So it seems most likely to me that there will be lower lows to come below this morning's lows. I don't have an opinion on whether Monday will be an up or down session. For those that are moderately skilled in technical analysis and are able to monitor the markets a bit, it seems sensible to use a SPY 15 minute chart with MACD and exit if/when there is a 15 minute bar that closes at a new low for the decline, but the MACD lines are not at a new low.
But for the simple/safe method, the past stats indicate an exit at tomorrow's close for the equity side of the trade.
For the SPY put option recommended, it would likely take another 3 points down in SPY before hitting the 100% profit target from my entry, though my entry was not outstanding, and the last several days had much better entry prices with gains already reaching or nearing 100%.
I am still maintaining my 100% profit limit order for possible exit of the trade.
Pete
Thursday, September 1, 2016
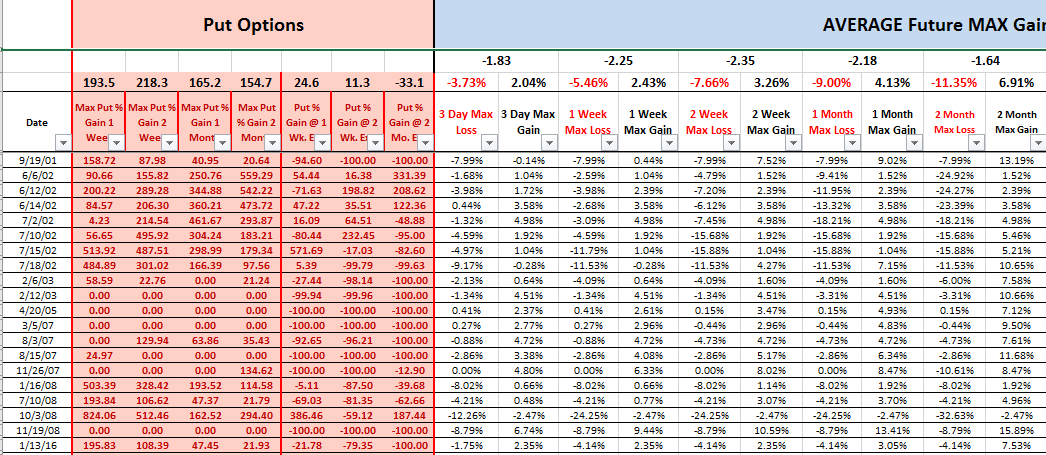
Probable Pullback in Stocks Over the Next 2 Weeks - Put Option Trade 9-1-16
I ran a simple scan this morning based on recent market action.
- 5 day moving average of total put/call ratio was above its 1 standard deviation bollinger band
- VIX high was less than 15
Typically I view the top condition as a bullish set-up, meaning when the put/call ratio elevates to an extreme, stocks are about to rebound. However, the second condition shows a market which has been very low in volatility and is not "oversold" or exhibiting much fear as evidenced by option premiums.
So what we have is potentially the early signs of the low complacency starting to break. So I tested to see what happened after past similar instances.
Over the next 2 weeks the MAX loss was about 3 times the max gain in SPY. So there is a significant bearish skew. Some of these signals come in clusters, so I only looked at results relative to the first day of a cluster and removed the rest. There were 9 unique instances left going back to Sept 1995.
Setting a 4% limit gain order on SPY and a 4% stop loss order (both relative to Wednesday's close) and shorting SPY has been a profitable play in the past. If the limit orders are not hit within 7 days, then exit the trade. So exit at next Friday's close if the limit/stop is not hit.
For options, 7 out of the 9 past instances showed an increase of 100% or more when buying an ATM put option with 2 weeks until expiration. So in this case a 217 SPY put expiring either next Friday or the following Friday would both be OK here.
I personally have an order to buy a Sept 16th standard expiration SPY 217 put for 2.35. It would take some rebound from this mornings lows to fill the order. SPY would have to rise to 217 to 217.35ish to fill the order probably.
Pete
Friday, August 5, 2016
VIX and McClellan Oscillators Give Further Warning That Stocks Will Pullback Soon

Click on Chart to Enlarge
Short term, the hourly chart of the VIX is in the formation of a sell warning which I have highlighted many times on the blog. VIX is below the longer term bollinger band (and the standard bollinger band) and the shorter term bollinger band is below the longer term band. So this is a dual time frame type of signal that there is a statistical extreme or imbalance in the short term trend relative to the longer trend.
Additionally, as of current intraday values, the daily VIX value is below its lower bollinger band. I have backtested that simple condition going back 20+ years, and there is a short term negative skew in forward SPY returns for a week or so after the signal. Longer term, looking forward several months that signal itself is not really bearish, but the forward returns are a little muted.

Click on Chart to Enlarge
This chart is of the McClellan Oscillator which is a measure of advancing and declining issues trend. It basically works like other oscillators in that trends will tend to turn NOT when breadth is at a peak or trough, but after an extreme followed by a divergence in the oscillator relative to the price action. In our current environment, there are bearish divergences in the oscillator indicating that the new price highs are occurring with fewer stocks advancing than at previous highs.
Now the really significant thing I see (but without any backtested data), is that the value of the oscillator is still below zero despite the new highs in prices. This occurred earlier this week as well. Now, again without backtesting, I can only speak to memory of observed cases like this, but notably the Sept 2014 price high, occurred with consistent McClellan oscillator readings below 0.
So from my perspective the current environment of stalling after a breakout to new all time highs, short term divergences and waning breadth, and major "smart money" selling into the breakout, is a caution and potential for a failed breakout which could lead to a significant correction.
My suggestion is certainly don't buy here. For short term speculation, I don't have any real strong bearish study to alert to, but from the factors I have looked at here relative to VIX and bearish divergences, it seems there is at least a mild negative skew for upcoming weeks.
Pete
Thursday, July 28, 2016
Quiet On The Trading Front - Some Longer Term Commentary Based on Commitment of Trader's Positions
I have been quiet here on the blog because there has been nothing compelling that I have seen in regards to initiating any new trades. The last studies I ran which had any compelling back test were the bearish studies from July 11 and 12. Prices have basically traded sideways since then. The forward outlook from those studies was negative on average from the 2 week mark all the way to 2 months ahead. So maybe we will see some level of selloff occur within the next several weeks, but I really don't have an opinion here.
On a longer term basis I have a few points of observation.
Since July 12, commercial traders in the CoT report have made a substantial increase in short positions in combined Dow, SP, Nasdaq futures. They are now holding the largest net short position in about 16 months (since before the May 2015 highs). While this doesn't mean the market will stop rising, it shows the "smart" money is betting on lower prices and/or that the market is "overvalued" here. This type of signal is significant, but further price highs could actually add fuel to the bullish run because the smart money may cover short positions if they don't hold prices down here.
Gold futures have hit a new record net long position in large speculator contracts on this move up the last several months. And the commercials hit record net short. Multiplied by the $ value of each contract they may not be quite at a new $ record holding ( I havent tried to calculate this). On the surface this occurrence seems to suggest that gold's bullish run/bull market may not run much higher before a major correction (and possibly move to new lows) occurs. Right now I feel there is no other legit interpretation other than to exit any long gold positions on a trading basis. Don't be caught up in the hurrah and yesterday's trend.
Oil futures made a rebound into this spring with no net new long positions in the futures market. And interestingly, the long positions have remained near record net long levels which in the past few years have coincided with major price peaks in oil. The only net change in positions of significance on the rally in oil was declining net short positions. So the oil market rose on short covering only. That is not what a textbook bottom/new bull market is "supposed" to look like. Think of the underlying psychology there, or even the pragmatic monetary dynamic of this. If no new long positions were added on the substantial run up, it may be that there is no funding/ability to collectively increase longs in the speculative camp. All the bets may be cast already. If that is so, and oil has already turned down substantially from its recent rally high, prices may have way further to go down with very little capacity for new funding to come in on the long side and support prices. My take is that what I have just described is the approximate actual scenario. It seems to me that oil will get crushed further in this bear market.
These dynamics would be suggestive of further US Dollar Index gains based upon intermarket relationships. Also the futures positions of the US Dollar Index showed heavy smart/commercial interest at the lows this spring. So a major base may have formed setting the stage for another move to new highs in the US Dollar Index in coming months.
So back to the stock market....does this mean? I think it portends a deflationary (continuing) back drop, which in the past has been a negative environment for stocks.
That being said, my only real interest in the stock market is the shorter term moves which I can speculate on based on quantifiable past market action. So I will continue to attempt to provide timely trading analysis whatever unfolds in future trends.
Pete
Tuesday, July 12, 2016
More Bearish Studies Triggering Today
I will relink to a post made in April which had the same set-up as occurring today. An additional set up is also occurring which triggered in April.
Also I added the condition of the day's high exceeding the bollinger band, and the results had an even greater bearish skew.
Also we saw the study which triggered yesterday regarding the VIX and SPY both being up with a low VIX/VXV. Today the VIX was up slightly even though SPY was up more than 0.7%. That combination had a negative skew looking forward as well over quite a number of instances.
So my take here based on the objective past history of SPY is that after this little break to new highs on the SP500, there is a strong chance of at least a sell off back into the previous range before the rally continues.
At this time I don't have much perspective on whether the recent break to new highs is necessarily a bullish signal. Given that other indexes (QQQ, IWM, NYSE) are still below their highs, I think that calls into question the long term strength.
But from a trading standpoint, all we really need is to have solid info that gives an edge and then manage the trade and the risk amounts well to profit all along the way in little bits and pieces.
Let me know if there are questions on specifics of the trade here for your situation.
Pete
Monday, July 11, 2016
VIX Up and SPY Up With Low VIX/VXV - New Put Option Trade Indicated
Today's action in SPY triggered a study that I showed back in the first week of June suggesting a short-term bearish skew in the market. We did indeed see that.
So the basic set-up here is that SPY is up today, but so is the VIX. And the VIX/VXV ratio is pretty low at the same time.
So the study is:
- VIX/VXV less than 0.86
- VIX up more than 2%
- SPY up more than 0.1%
There are now 10 instances which have occurred in the past which meet this set-up. And 9 out of the ten showed gains of 40% or more over the next 2 weeks when purchasing an ATM put option with 2 weeks until expiration.
9 out of the 10 instances SPY showed MAX losses of at least 1.25% over the next 2 weeks.
So the trade here is to buy a July 22nd expiration SPY put either 213 or 214 strike. I would use a limit order equivalent to today's closing value on the option if entering tomorrow.
For equities, the best play has been to set at limit order of 1.25% gain as well as a 1.25% stop loss order. Then exit after 10 days if the limit or stop have not been hit.
Pete
PS - Let me know if there are more specific questions on how to play this.
US Bond Prices Nearing a Blow Off Top

Click on Chart to Enlarge
This chart is the TLT etf which is composed of long term US bonds. I have highlighted the upper boundary line which has been a resistance line going back several years. The whole price formation over the decade has the look of a massive ascending wedge or terminal impulse type pattern.
Currently price has slightly overshot the upper boundary line on the chart, and so a top could form in the coming weeks. A more drawn out bearish divergence pattern on the current leg up may be ideal before a top occurs. As of today neither daily nor weekly MACD is showing a bearish divergence in the current leg up. So it seems there could be some time spent forming a divergence in upcoming weeks.
While the focus of this blog is very much on SP500 analysis and the shorter term trading opportunities in that market, bonds and rates are major factors in our economic life and outlook. My take from this is that the interest rates are hitting bottom, and this current run up in bonds, could well be the last hurrah. I would suggest rising interest rates and falling bond prices for months, and possibly years to come. At bare minimum, bonds don't likely have any significant investment potential for gains in the underlying prices given the 0% interest rate bound. So I would be strongly suggesting getting out of any bonds held in retirement accounts. The best place for available funds may simply be cash or equivalent short term treasuries at this stage.
Pete
Tuesday, June 28, 2016
Major Flip Flop In Strategy Based on Today's Action in SPY
Today the VIX dropped over 20%. This has only happened 9 other times going back to September 1995. The forward results showed a very strong negative skew even in the short term of 3 days. That was slightly lopsided by a couple massive downers in October 2008, but looking ahead 2 weeks, 7 out of the 9 showed greater max losses than max gains.
So the point here is that we have the conflicting study from the last couple days, which suggested a rebound (which we saw already in some significant measure today) that may last several days. And now we have information suggesting that there is risk of immediate downside with 6 out of 9 instances closing lower 3 days ahead.
So if a call option was established with the expiration at this weekend, my current recommendation would be to exit ASAP, like at the open tomorrow.
I may provide stats on a possible put option trade if the rebound extends further from this level.
Pete
Monday, June 27, 2016
Backtests From Many Angles Suggest Probability of a Rebound Over the Next 4-5 Days
I have spent some significant time over the last couple days performing scans comparing the current market status to the past history in SPY. And from a number of different angles the stage appears set for a rebound in stocks.
The backtests have pretty consistently shown the 4-5 day forward time frame as having the most notable strength. So there are bullish plays here in both SPY options and the equity ETFs.
Now longer term, the results of the scans were not as consistent looking ahead 1-3 months.
My personal assessment from the technical side is that stocks still will fall a significant amount in the coming months. So the expectation may be for a short multi day rebound which will punctuate a continuing decline, and also may offer an opportunity to enter a bearish position on the rebound.
The backtests which I have run suggest that if SPY gaps down tomorrow, buying an ATM call option with the expiration at the end of the week would likely be a profitable play.
If there are any questions on specific ways to play this let me know.
Pete
Aug SPY 212 Put Limit Order Final Exit Acheived
The SPY 212 August expiration put which was entered at around 5.15 earlier this month, has now moved up in value beyond its 130% limit order which was the highest value given (at entry) as a possible exit limit dependent on position sizing.
So that trade is now closed. The equity portion of the trade has not quite achieved a 6.75% loss in SPY yet relative to the entry through another 1% decline would fulfill that limit order. It seems there is a high probability of that occurring.
The market is now set-up for a short term rebound and bullish play, I may offer some further stats on this later today or over the next few days as things unfold.
Pete
Friday, June 24, 2016
Big Gap Downs Most Often Lead to Rebounds In The Coming Week
I will provide more stats after we see the close today, but with the big 3% gap down in SPY, a set-up is definitely in play for a rebound into next week. The backtest stats are good for both equity and option plays with expiration ending next Friday or exiting the equity trade next Friday.
So this is a heads up that a position may be taken before the close today. If there are immediate questions regarding possible positions, let me know ASAP to do some further back testing prior to the close today.
Pete
So this is a heads up that a position may be taken before the close today. If there are immediate questions regarding possible positions, let me know ASAP to do some further back testing prior to the close today.
Pete
Wednesday, June 22, 2016
VIX Increases With Elevated Put/Call Ratios
I ran a scan today looking back at times when the VIX increased more than 12% and at the same time, the total put/call ratio was greater than 1.05.
This back test resulted in a significant bullish skew in the SPY options over the upcoming 1-2 weeks.
When I added the condition of VIX/VXV being greater than or equal to 1.0, the results were even more outstandingly bullish. The results were not much different for bear market versus bull market moving average configurations.
So the implication here is that the market may rebound after the Brexit announcement.
Buying an at the money SPY option with 1 or 2 weeks until expiration, and using limit exit orders of 40%, 60%, or 80% to exit while letting losers expire worthless all led to positive expected values. Since there are only 2 sessions left this week, I would suggest buying the July 1st SPY 208 call and using the 40% limit gain order would be an appropriate trade.
If further details are needed regarding position sizing, etc, let me know.
Pete
Thursday, June 16, 2016
Rebound Suggested After the Open Today in SPY
In follow up to the information I posted yesterday, going back to late 1995 there were 44 instances where there were specifically 5 closes down in a row. And only 12 of them showed a gap down the following day. But the average open to close return on that day (today in our case) was 1.2% which is huge for these types of stats.
Now our environment is lower volatility, and I don't really expect to see that kind of a gain, but the suggestion here is that things are likely overdone in the short term, and multiday rebound is likely.
The 12 instances with gap downs showed about 2.25% return in SPY over the next 5-6 trading days.
Again our volatility is a little lower than others in this batch, but it makes sense that we could see a rebound into next week.
Pete
Wednesday, June 15, 2016
5 Days Down in a Row for SPY ETF 6-15-16
SPY closed down for the 5th day in a row today. Yet the sell off has been mild.
I ran a scan looking back at time when
I ran a scan looking back at time when
- SPY closed down for the 5th day in a row (not more or less)
- VIX high for the day was less than 30, indicating only moderate volatility
And the results had a notable bullish skew for the next 5 days. The best option profit opportunity was to buy an ATM call option with 1 week until expiration and set a limit order of 140% gain or let it expire worthless.
So, there are 7 days until the expiration next Friday. But most of the gains came in the first 5 days in past instances. So the way my model is constructed I would guess that the 140% gain would be a little too high to be realistic, but possibly 80-100% would be more realistic.
In any case, this set-up add further confirmation to the idea that a short term bullish rebound will likely occur into this weekend or beyond.
The strongest skew in the future equity returns occurred in the first 3 days, where the MAX gain was about 1.85 times the MAX loss. So there is a profit opportunity in an equal magnitude stop loss order and limit gain order.
If there are any specific questions on this let me know.
Pete
Back Tests on Days When the VIX Increases More Than 20%

Click on Stats to Enlarge
The VIX is an implied volatility index, based on actual option prices trading in the market. So a big jump in the VIX shows a real money indication of anticipated increased future volatility.
Monday was an interesting day in the VIX as the VIX jumped about 23%. That is not very common, but also is not the really interesting thing. What is more interesting is that going back to September 1995, where I have data to backtest, the VIX has never increased over 20% on a day where SPY was note down at least 1%. However, I looked for days when SPY was down less than 2% to give a sensible comparison, and the results for the next 1 and 2 weeks were both consistently bullish with good profit factors in both options and stocks.
I ran another simple scan which looked at VIX up over 20% but the SPY close was not below the lower bollinger band. About half of the days had SPY closing below the lower bollinger band. And the scan results are shown above for this scan. Notice the very consistent wins here - over 90% with correspondingly high expected values and Kelly Bet %.
So relative to Tuesday's open in SPY June 17th 208 calls, the option opened at 2.75. And so a limit gain of 40% would be about 3.85 as a limit order. There is not much difference at 4 or 5 days ahead, so choosing this week's expiration seems sensible.
If moving out to next week's expiration, the optimal limit order on the 208 call would be 80% gain. And the EV is only about 13% and Kelly bet is 16%
The instances where the next day, in this case Tuesday, closed down, 5 out of 8 closed up more than 1% over the following 3 days. This suggests there may be a tendency to rebound into the end of this week. So buying here could still be justified with a smaller position.
Pete
Tuesday, June 14, 2016
SPY August 212 Puts Hit 70% Target Limit Order
In a recent post I had suggested that a mix of expirations strikes or limit orders could be used to speculate on put option at the recent bearish set-up for SPY.
One of the options was the Aug2016 212 put. Entry price was 5.15ish. One of the limit orders suggested was 70%. That level was achieved today relative to a 5.15 entry.
Another limit order on this same option was 130%. The fraction of the account put into the trade would differ in each case based on past stats and optimal Kelly Bet position sizing. But if that order is in place, it still appears to have plenty of time to potentially hit the limit order.
Comment or reply if there are any questions regarding this position.
Pete
Saturday, June 11, 2016
SPY Put Option Exited for 40% Gain in 2 Days
The 40% gain limit order recommended for the June 17th expiration 212 SPY put which was purchased on 6-8-16 was already hit as of the end of the week. So far the option has increased over 50% at maximum from the entry.
Now the equity portion of the trade still has quite a ways to go in terms of price and/or time before an exit will be made based on the stats and orders suggested in the last post.
Additionally, if you purchased the August 212 SPY put, giving about 2 months until expiration, then the entry price was a little above 5.00, and the maximum price has hit about 7.00 so far. So the options is up about 33% so far. The suggested limit orders were 70% or 130% for this expiration.
Pete
Tuesday, June 7, 2016
Put Option Trade on SPY 6-8-16
Today was a potentially important day in stocks given the backtests which I ran today after the close of the market.
Here is a relatively simple scan:

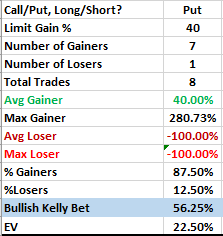
Here is a relatively simple scan:
- VIX/VXV less than 0.86
- VIX up more than 2%
- SPY up more than 0.1%
Now the VXV has a limited history going back about 8 years. So we only have instances from the current bull market to judge. However, I ran the same basic idea and removed the VIX/VXV filter and instead ran added a filter of the 5/63 day total put/call ratio being less than 0.92. And the same approximate results occurred even with different days showing up.

Click on the Chart to Enlarge
This chart shows the summary of future returns for the next 6 months. We can see there are not many instances, but basically stocks had run out of steam and were set for a significant pull back over the coming weeks, beginning soon. The skew is very negative over the coming couple months.
As for the options there are profitable plays in several different strikes and time frames I am sure.
But I think the most sensible is the following purchase of an option.
Click on Chart to Enlarge
This chart summarizes the past results of buying an at the money put option with 2 weeks until expiration and setting a limit order to exit at a gain of 40% or letting the option expire worthless.
7 out of the past 8 instances hit the limit order making for a very nice opportunity.
In the current circumstance the closing value of SPY was more negative at 8 days forward compared to 10 days forward, so it indicates that the maximum gain was likely to occur within 8 days from entry of the option. So the option to purchase would be the standard June 17th expiration option. In this case I would go with the 212 strike put on SPY.
The key to long term success once a profitable method is obtained is to have as close to optimal money management as possible and to always stay "in the game". So my point here is that the above profile suggests an aggressive position is very justifiable. But if you use a simple % of account allocation on all trades, then there are many profitable orders. Buying 2 months until expiration and setting a 70% or 130% limit gain and letting losers expire worthless will also both provide profitable plays based on past stats, and allow for this month's expiration to pass if there is anything holding the market up through expiration.
So it may make sense to take the full position and split it into 2 parts, with half in the 2 week until expiration and half with a 2 month expiration 212 SPY put.
On the equity side, entering short SPY here and then setting a paired limit order and stop loss order of 6.75% or exiting after 2 months was a simple a nicely profitable trade. The expected value on SPY was about 3.5%. Stats allowed leverage of 3x on the whole account if using a triple leveraged bear ETF. So the return expected on the account would be about 10% expected over the next 2 months by using the 3x inverse ETF. This would be a more conservative play, but one that could be used in all types of accounts and provide a standout return during an expected downtime in the markets.
I know this post has a lot to sort through, so comment or reply if you have questions regarding the info or your situation.
Pete
Subscribe to:
Posts (Atom)