Wednesday, December 4, 2019

SPY Downside Volatility Breakout - Projections for Potential Decline Into Early January 2020

Click on Chart to Enlarge

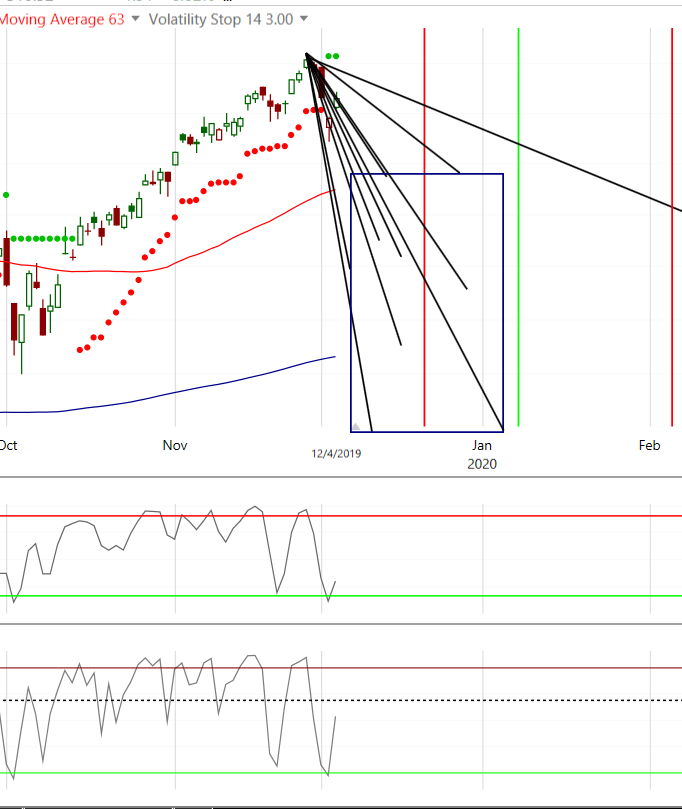
Yesterday SPY closed below a trailing 3 ATR volatility stop.  I looked back over the last few years at the decline from high to low the other times the volatility stop was broken.

I excluded a few in the middle of 2017.  That market environment was exceptional/historic momentum.  A few breaks that year were smaller than the average on this chart, but for our purposes I am just showing a range of expectation.

So from the precedents here, it seems likely that price would retest the recent highs from September, and possible decline well below that before the correction is over.

As long as price stays below the recent highs, I would anticipate possibility for a sharper sell off into the new year.


Thursday, October 3, 2019

High Probability Set Up In Stocks - Short Term Rebound Expected 10/3/19

SPY has closed below its lower bollinger band for 3 days straight.  That itself produces a robust signal with high probability of short term skew to the upside in stocks in coming days.

Factoring an uptrending market into it improves the signal.

Also as of today we are seeing some extreme readings in the put call ratios.  I have looked at these readings coupled with a variety of other combinations of data from today's session, and there consistently is a high probability of a higher close in coming days.

There is approximately 90% probability of a high close than today's close within the next 5 days.  Including any losers, the average trade return is quite good - depending on the scan combination, around 1% expected value or higher.

Most of the scan combinations I looked at had higher expected values by holding for either 2 consecutive higher closes OR two higher closes within the next 5 days.  This strategy dropped the win percentage down to the 80%+ range but produced a higher expected value on most criteria combinations.

In summary, I expected some chop and volatility into next week, possibly with lower closes yet to come, but the odds appear to be high for a higher close above Thursday's close within the next week.

Tuesday, September 10, 2019

Cotton Showing Extreme Trader Positioning - Suggests Major Rally Is Imminent

While I do not trade futures, I follow many commodity ETFs and am most comfortable and profitable with trading those markets, in addition to stock indexes. 

Currently, cotton is in an extreme positioning where the producers (red line on bottom panel) are actually net LONG.  These are the farmers, etc who produce cotton and who typically are using the futures as a hedge against their physical product. 

So they are almost always net short.  For the data breakdown going back to the mid 2000's, there is not another time that producers have been net long.  So given that price is hovering right near a 10 year low and the producers are indicating they don't need to hedge, I think this market is on the brink of a bear market low, or at least a major rally.

Speculative short interest is at an all time high, so there is plenty of "fuel" to feed a major vertical type rally if/when it gets going.  Short covering can lead to quite large and rapid upward spikes off major lows.

The last major rally in this bear market was about 10% in 2 months.  But a short covering rally off a low like this could be more like 20-30% in 2 months or less.

Click on Chart to Enlarge


Thursday, September 5, 2019

Silver and Bonds Look to Have Completed "Blow-Off" Tops

Both silver and bonds have recently spiked into a common type of blow-off top pattern, some off which I have highlighted on this blog in recent years.

Sentiment and large trader positioning is ripe for a trend reversal or stall.

If you are one to get caught up late in a trend when it is obvious, my suggestion is that this trend has run its course.  And now is time to exit on an intermediate term basis, certainly NOT to get sucked into what WAS a strong trend.

Pete

Monday, August 5, 2019

Short Term Rebound is Highly Probable over Next 3-5 Days in SPY ; Longer Term, BEWARE 8-5-19

Click on Chart to Enlarge

There are multiple short term extremes showing up right now indicating high probability of a short-term rebound in stocks.

Based on multiple back-tests of different data sets (price, volatility, put/call ratios), I would estimate the probability of a close above today's close within the next 5 trading days to be about 90%.

The chart above shows the average price action over the next 3 days in terms of 10 day ATR. 
These projections are based upon the price set-up of 3 consecutive closes below the lower bollinger band on SPY.

  • The average close 3 days ahead has been about +0.9 ATR.
  • The average maximum gain over the next 3 days has been about +1.85 ATR which would put price up around yesterday's low.
  • The average maximum loss over the next 3 days has been about -1.0 ATR which is about 4.00 on SPY currently.
  • Also of note, for the same set-up, 50% of past instances filled the gap open down within the next 3 days.  So about 1/2 the time we could expect SPY to trade back up to 292.62 or higher within the next 3 days.

Now, on a longer term basis this looks very much like a bull trap topping process, and there are multiple long term price and sentiment divergences to suggest that a bull market high could be in on this recent failed breakout to new highs.

My personal stance is to continue to trade with a bearish perspective as long as new shorter term technical sell signals occur below the recent highs.


Pete

Monday, January 14, 2019

0.5% Gap Downs 3 Days In a Row

There have been 3 days in a row of 0.5% or greater gap downs in SPY as of today.  Action after the open has been relatively tame with no big down days.

Without factoring in any other data, just looking at the 3 gap downs in a row, there were 26 instances in the history of SPY (back to late 1995).

19 closed above the open on the day, with an expected value (including losses) of a little over 1%.

Also, 20 out of the 26 filled the gap down of the most recent day (today in this case) within the next 2 trading sessions (by Wednesday in this case).


The flip side of this is that, there are some signs that suggest a pullback is probable.  So I am looking to make an inverse trade on the index ETFs.  But the data above suggest we may anticipate a fill of today's gap before considering an inverse position.

I am monitoring the 30 min and 60 min SPY charts with a 3.0 volatility stop as an entry signal for a short/inverse trade.

The above data also basically fit with what I am seeing from time cycle analysis.  Short term the cycles are up until Tuesday/Wednesday, than are turning lower into next week.


Pete