Thursday, July 30, 2009

AAII Survey, Today's Gap Up, Magazine Covers, BGZ Stopped Out (Ouch)


Click on Charts to Enlarge

I started this post yesterday and then part of it got deleted accidentally and then I got predisposed and didn't finish.

Well, the BGZ posted stop was hit yesterday for possibly the world's worst trade. The posted exit will be the opening price of 27.63 yesterday. If you were clever enough to set your own stop at better prices, then that's good. I wasn't so clever, however, I may just be clever (or dumb?) enough to get back in today with a stop a penny below today's low in BGZ due to the pretty nice, high volume shooting star right at major resistance that formed yesterday coupled with a bunch of intermediate overbought indications.

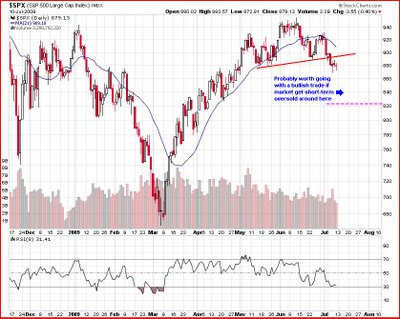
The evidence is starting to mount that the market is reaching an intermediate term overbought condition. I will try to cover a bunch of data in a video this weekend, but as funny as it seems, the market has gone from modestly oversold to significantly overbought without barely a breather in the space of just over 2 weeks. The S&P 500 approached the 1000 mark yesterday which based on some Elliott wave pattern interpretations would be an idealized ending topping point for this rally. Also as shown above, as the market move into the 1000-1040 range there is major horizontal resistance, the type which has led to pullbacks so far on this rally.

Other factors of note.....The top picture above is the most recent Newsweek cover. Thanks for letting us know. I'm sure the call will be timely as you and other fine mass media publications have such a good track record at early identification of economic and investment trends. (Hopefully you caught the sarcasm). For anyone who has not heard of the "Magazine Cover Indicator" you probably should google it when you have 5 minutes that you aren't going to use productively. While this is not as provactive maybe as some past notables, the magazines sell what people want to hear and believe. It is obviously yet to be seen if this will be added to the list of obviously stupid and dead wrong timing covers from the past, but it is interesting none the less.

Also shown above the AAII (individual investor) survey took a huge jump in bullishness this week and is now almost 2 standard deviations from its 1 year mean. Bearish opinion made a corresponding large drop putting the bull ratio at its highest level since last spring just prior to the May 08 market peak. The current level is not too extreme in the history of bull markets, but it is still enough to worry about a rally's legs for someone with a shorter term time frame.

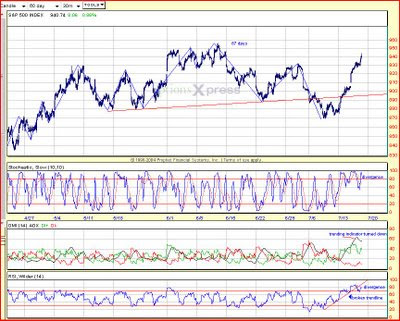
The bottom chart shows a 60 min chart of SPY. I am just noting that yesteday was the 2nd biggest gap up in the recent 2-3 week rally. Seeing as there was lack of follow through during the day, a close below the open, approach of major resistance, and extreme short-term overbought conditions, this may be an exhaustion gap. They typically occur at the end of an advance and occur in conjunction with a "news" item (in this case unemployment data). IF it is, then prices will probably close below that gap in the next day or two. I'm not necessarily saying this will be a major top, but it sure seems like some significant consolidation or give back will have to happen to refresh interest from the smart money.

I'm still awaiting a legitimate oversold signal on the SDS trade to post an exit there.

Wednesday, July 29, 2009

New UUP Trade

Click on Chart to Enlarge

The chart above is UUP which is a bullish US Dollar ETF. It is designed to track the performance of the USD Index and does so very closely.

In the last 2 months I have shown data and pattern possibilities on the USD/Euro relationship, and the take away message is that there is extreme bearish opinion on the USD with a corresponding major long term bullish reversal pattern that appears to be forming. I have been looking for a good opportunity to trade this for months, and I believe that the lowest risk relative to reward potential is occurring now.

The chart shows a wave 2-4 trendline, which when broken (assuming a 5 wave move is occurring) signifies the end of wave 5 in most cases. If price does not move up quickly or makes a new low, then there is a possibility that an ending diagonal is forming for wave 5 and would require a little patience and then re-entry. The blue rectangle/box indicates what needs to happen to confirm that the proposed scenario is indeed likely to be happening. UUP needs to rise to 24.10 or higher in the next 2 weeks (completely retrace wave 5 in less time than it took to form).

The 2-4 trendline has been broken today in conjunction with a recent slight undercut of the wave 3 low and reversal back above it. There are major bullish divergences on the technical indicators to go with everything else, so I really like the looks of this trade.

Now, since this is a currency ETF, the % moves will be small, but the point is that the reward relative to risk is huge. If the large scale pattern I have suggested is accurate, then price should move above 27.00 in the next 4-5 months, making greater than 10 to 1 reward on risk if entering now. You don't get those ratios too often on a trade, so I am going to suggest a trade on this for the blog.

Money Management

I would suggest risking up to 1% of trading account value for this trade. The caveat is that it would only take 1.3% decline in UUP to stop out the trade, so it would be possible to put about 66% of trading account value in this and still be risking only 1% of account if stopped out. I wouldn't suggest that because that ties up too much account on 1 trade idea. The volatility on this will be VERY low compared to the leveraged ETF trades I usually post. As a general guideline I would say that putting 20% of trading account (using the suggested stop loss) in this may be reasonable, but it will vary person to person. If you have a fixed $ amount or % of account that you usually devote to blog trades, you could just go with that amount or a bit more because the volatility will be so low on this comparatively.


Trade Action

Buy UUP today with a market order. Blog entry price is 23.67. Place a GTC sell stop order at 23.33 immediately after entry.


So just to quickly sum it up with an example, if your trading account is $10,000 and you devote 20% of your account ($2,000) to this trade, you will only lose 0.29% of your account value if stopped out of the trade. That is a tiny risk, however, there will be other trades in the future that will offer far greater absolute return potential, so I wouldn't tie up too much $ on this trade even though the risk to reward potential is outstanding.


Pete

Tuesday, July 28, 2009

BGZ Stop Placement

Yesterday was the first time in the last 2 weeks that the data showed the "smart money" starting to really bet against further rally as evidenced by the highest OEX (S&P 100) put/call ratio since early June (it was 1.63). Additionally, the equity put/call ratio (dumb money) was the lowest in a couple months at 0.54. While this should only be taken as a short-term signal, I dare say it actually looks like it might "work."

Also, after 11 straight days of higher lows, today prices broke below yesterday's low. Also as of the time of this writing, the high made in the S&P today is slightly lower than yesterday creating a potential swing high. So, these factors at least give a reasonable "line in the sand" to set a stop, with potential for some downside awaiting a solid short-term oversold signal to exit the trade. As a side note, the OEX put/call ratio is running quite high so far today, again indicating that to this point the smarter traders are thinking that some more downside is quite possible.

Other points of note that may halt this trend for at least a bit are that the last 2 days, the Nasdaq volume has been very heavy compared to the NYSE volume. While this is more of a long-term signal that a short-term, even in an uptrend, when the ratio gets too high, there is usually a pause. Also, and maybe more indicative of short-term risk seeking is that Rydex fund traders have piled into bullish high "beta" funds over the last week or so. As of yesterday the data showed they were betting 6 times heavier on bullish high beta funds than bearish ones. Compared to past data that is very high. Even in trendshifts to the upside like mid March this year, it has consistently led to short-term pullbacks.

For those who are not familiar with Rydex funds or the "beta" concept......Rydex offers leveraged funds, both bullish and bearish. Much like SDS is a 2x bearish ETF and SSO is a 2x bullish ETF, Rydex would have similar funds available for investors with money in their funds. The SDS or SSO would have a higher beta than SH and SPY, respectively. So while Rydex is only one fund family, it is a large and popular one, and the data shows that their funds have been heavily shifted toward bullish risk taking in recent days -money is pouring into leveraged bull funds relative to leveraged bear funds.

Because of this, I think there is clear enough indication that a pullback is likely, that a stop can be set, and I'll live with the results. While setting stops is fine and just getting out when you've had enough can at times save you from further loss, my experience is that not setting a stop, and then exiting without any objective indicator will not lead to success in the long run.


Follow-Up Trade Action:

Place a GTC sell stop order on BGZ at 27.90. I will montior short-term indicators for exit in the near future - same goes for the current SDS trade.

Monday, July 27, 2009

Cancelled Buy Stop Orders for SOHU

SOHU is moving down today, and I have cancelled the buy stop orders I had placed on it. So for those who have studied IBD breakout type buys, using those buy stop orders will generally keep you out of failed bases, but will fill your order on the breakouts. Then after there is a breakout, it is important to see whether it occurred on heavy volume, and whether the breakout point holds as support on any pullback.

The best breakouts will either move up and not come back to the breakout price, OR they will move up a bit (say 10%) and then come back down to the breakout point but close above it on a weekly basis. IF there is a close back below the breakout point after buying a breakout, my opinion is that it is best to just cut the loss right there, and not wait to get stopped out if you weren't already.

Sunday, July 26, 2009

I've thought a lot the past few days about what to post this weekend and about reviewing the current SDS and BGZ trades, etc. There are lots of things worthy of mention, but they are not that well organized in my head for a post, and I don't know that charts, etc are really important in taking away whatever needs to be taken from these trades from my end or from your (blog followers) end. So here are some thoughts that may not be in any particular order....

-money management is the most important aspect of long term success. if following the basic guidelines I've given, a drawdown like this can certainly be regained over the course of several trades.

-depending on how you measure momentum or short-term trend persistency, the last 2 weeks have experienced sustained upside momentum only comparable to about 5 other 2 week periods in 100 years or more of the S&P 500. So we may have just experienced something that, in context, only happens every decade or so.

-in looking back at the both the BGZ and SDS trade, I can find no major flaw in the SDS trade compared with my normal filtering process, it is just a matter of an extraordinary market environment/event; for the BGZ trade, I am satisfied with the entry, but let a "belief" about the larger market environment, interfere with the trade management/stop placement

-there are both dramatic fundamental credit contraction forces as well as historically un- precedented credit market intervention contrary to those forces, and over the last year the market has experienced historically unprecedented moves both down and up. I fully expect that we will continue to see these types of moves periodically for some time.


After being on the "right" side of the market for basically the entirety of this blog's history, I found myself somewhat blindsided (I should say "I was blind to the market" rather than shifting blame to the market from myself) by this past week's market move. Without going back over all the analysis in recent months, my conclusions are basically that I wouldn't change much (if any) of my short-term analysis of patterns, etc, since the March lows; HOWEVER, I think the move this past week means that some aspect of my "big picture" view was off as far as integrating this move into the larger market picture. From the size and speed of this move up, coupled with historical studies looking at the few, but similar, instances of such persistent momentum, the outlook appears to be modestly bullish for the next few weeks at least. I will not get into any details of possibilities in this post though.

For blog trading I use both a systematic and a discretionary approach. The systematic part is defining trend and entering and exiting with objective indictors. The discretionary component is in pattern identification, etc, for identifying high probabilities of trend reversal. Additionally, any type of stop placement or movement prior to an objective exit signal, is discretionary. For anyone who has followed the blog for a while or looked through the "Best Posts" area, will understand that rather than using stops for most trades, I have given guidlines on risk control by position sizing. Again the reason is that for a mean reverting style of trading, use of stops will almost certainly decrease long-term performance. So, on a core level, I guess my goal with the blog style is more aimed at absolute return than avoiding any drawdown.

From looking back at the BGZ trade, 2 weeks ago I had noted on the blog that the short-term was tilted significantly to a bullish edge, but that I felt it was not "safe" to place a breakeven (or better) stop without high risk of getting stopped out of an otherwise good trade. This trade is probably the only trade since starting the blog that I really feel I should have done differently. While I am using an objective model for the trade exit potentially, at that point (due to the effects of trendless volatility on these funds), a stop should have been placed or just made an outright exit, and looked to re-enter. However, the main reason for the trade was that the June highs could have been a significant multi-month high from my perspective, and it wasn't until late last week, when that proved to be untrue.

At this point, there are several indications that the market "should" experience at least a period of consolidation over the next week or so. Maybe there will finally be an exit signal for the current SDS trade, possibly at better prices than current ones. The short-term model is still showing a glaring bearish divergence, and while this breakout has me convinced of its legitimacy, we certainly could see at least a sharp pullback for a couple days.


For the truly long term investment picture (buy and hold) I believe the current move to new highs actually is very negative in that "the bear market" may be less far along in its pattern, and probably price destruction as well, than my prior working assumption. While neither I nor anyone else has a crystal ball foreseeing precise market action, to the extent that generalizations can be made from a study of market history and human psychology, I could not suggest to a friend or loved one to move investments more heavily toward equities at this time. It takes a combination of knowledge and confidence to act contrary to prevailing beliefs in this regard, but in my estimation, there will be greater reward in the future.

Friday, July 24, 2009

A Look at YUM, Long Term Gartley Pattern and Possible Breakaway Gap Down

Click on Chart to Enlarge

This is YUM which owns several fast food restaurant brands. I have followed this stock since 2006, but only traded it once (for a loss in 2006). I have put a bunch of notes on the chart highlighting the importance of high volume breakouts, basing patterns, and successful basing patterns forming where the low of each successive base is at a higher level.

For long term reversal there are some classic signs....

-sloppy, jagged, and deep corrections (say 40% or more) after a series of more standard rounded shallower basing patterns

-the breakout to new highs from a sloppy base happens on volume that is very low compared to past breakouts

-A final tell tale sign is often when the most recent basing pattern does not even attempt a breakout, and price gaps down on heavy volume and undercuts the low of the base


Some of those signs were present on YUM last year. Now what we have seen is a 5 wave type of decline off the highs from last year, followed by a Gartley pattern ABC retracement. This is often a major reversal pattern. Additionally, on the recent earnings report, the stock gapped down off the highs on the heaviest volume in years. I would guess that this is a breakaway gap down. That is another classic topping sign - when the stock makes a very large gap down on the heaviest volume compared to entire bull run preceding it. Institutions are exiting en masse.

The last 2 weeks, the stock has been consolidating below its 20 day MA despite a stretch of market strength, the likes of which have only been seen once every few decades. I am strongly considering a short entry on this stock, and may even track it for blog purposes for those who have interest in some longer term type trades.

Also there is a somewhat similar bullish bottoming pattern occurring on TSO, which I also am considering a trade on after a short-term pullback. The great thing about these types of trades is not the bang-bang gains, but the potentially huge reward relative to risk over the course of a few months. I'll post again if I do make an entry.

Also, as a follow up, I am cancelling the buy stop orders on NFLX since it gapped down and is getting sold pretty hard thus far today. Because of that I will probably not even look at buying on a handle formation, as a large volume gap down in a handle is probably a bad sign for the basing pattern.

Thursday, July 23, 2009

NFLX and SOHU - Buying Breakouts

Click on Chart to Enlarge

The market appears to have broken out above the resistance I've been highlighting in recent days. Many stocks have made substantial breakouts the last 2 weeks, and while my views are not much different longer term, this breakout appears from a charting standpoint to allow for substantial further gains in the indexes. I'm not wildly bullish for sure, but there is no chart resistance for another 5-6% on the S&P, so I would expect the market to move toward those levels if the breakout holds.

Anyhow, for any coming short-term trades I will be focusing on bullish trades as long as the indexes remain above the 20 day MA. Since the June highs were taken out, that opens the possibilty, that even if we are still in a long term bear market, that the March-May/June move could just be the first leg in an a-b-c or w-x-y type of pattern. I don't really have enough of a grasp on it yet to really know what to expect on those grounds.

Now the post today is showing 2 stocks that I have buy orders for. I wanted to explain the rationale and show how to deal with potential buys around earnings. Most people are heeded not to mess with stocks before earnings and gamble on the outcome, which is probably good advice. But on the other hand, many nice breakout buys happen on earnings reports, and if you don't know how to trade them, then you will often miss the boat if following a breakout strategy like Investor's Business Daily teaches. Also, many of the best possible buys using this method will advance relentlessly after breaking out to new highs on big earnings gaps, and you never get a great buy point after that.

The chart above is Netflix, NFLX. I traded it once before early last year as it formed a similar basing pattern and broke out, and I made a quick 15% or so on the trade. The chart has basically all the notes. But earnings is after the bell today I believe (from yahoo finance). Now looking at the chart, it has formed a pretty nice base, and is picking up volume as it is moving toward the old highs. The problem is that there is no "handle" on the chart fo a buy point like IBD teaches. So you have to go with the old high as the buy point. Stocks that don't form handles and gap big to hew highs on big volume, often don't even come back down to the breakout point, so the orders I am using are 50.27 with a buy stop. Then a stop would have to go around 47.00 if the order gets filled.


Click on Chart to Enlarge


This chart is SOHU. Earnings is Monday morning I believe for this one. Again, since it is risky to buy before earnings, I have a buy stop order at 68.10, so that if the stock moves up strong above the "b" point, then the order will get filled. Then if filled, a stop should go abouot 7% below the entry price. However, from my experience, I don't like to see the stock close below the breakout point on a weekly close after breaking out. So if it does, you just exit right away with what will often be a very small loss, rather than wait to get stopped out.


In both these cases, and as a generalization, breakout plays will often make large gains in a short period of time and then its done. So you have to know ahead of time when to buy and place orders, so you aren't the late comer waiting till after the breakouts. You can often get some good buys that way in a bull market, but even so, the ones you catch will often be weaker stocks that don't just zoom up right away or make as big of gains.


So I am not going to track these on the blog, but I will make a post when I exit them (if the yget filled). So treat this as an educational post, but if IBD type methods are not something you are familiar with, you probably shouldn't even consider using this as any type of recommendation. If you are familiar with those methods, then both these are IBD 100 stocks, and you can do your homework and figure out whether they interest you personally.


Pete

Wednesday, July 22, 2009

2 Days of Stalling- DIA and SPX


Click on Charts to Enlarge

The notes are on the charts for the candlesticks, etc. The charts aren't really in the order I envisioned, but I don't feel like doing more clicking to switch them.
The top chart from sentimentrader.com shows Up Issues (% of stocks up on the day) and Up Volume (% of volume going into stocks that are up on the day) for the last 10 days. Notice how for the last 5 days there have been successive lower peaks even as price has gone almost straight up. That is occurring on both the NYSE and the Nasdaq. So what is that telling us? Fewer and fewer stocks are carrying the market each day. Participation is narrowing substantially. While this is only a shorter term indicator, after 8-11 straight up days and narrowing breadth, you have to assume more than a blip of a pullback will occur very soon.

The next chart also from sentimentrader.com shows the primary model I use for all blog trades. Same thing here. A massive divergence for the last week. That is also visible on the TICK chart in that image as well. Now, it doesn't feel right to say that this is a stronger than normal bearish signal when the market has powered through the signal for 6 days in a row, but the only time I remember seeing a divergence like this was at the March lows this year (which was a bullish divergence).

It didn't feel right then either, but if anyone recalls the trade there, I suggested placing limit orders to catch QLD as it undercut the Nov lows, potentially forming a double bottom. In that case the S&P had broken below support from the Nov lows but the Nasdaq hadn't. In the current case, the Nasdaq has broken through resistance, but the S&P hasn't, putting the S&P in a potentially weak position and forming a possible double top to this rally. That QLD trade turned out to be the best trade of the year so far. While right now even I am convinced that the market will go up roughly 1 billion percent per day from here on out, objectively I still have to believe the market could be on the verge of a major turn.

In any case there has been no exit signal for the SDS trade yet, and I am waiting to see if this resistance/double top holds before exiting the BGZ trade.


Tuesday, July 21, 2009

An EWT Look at the USD

Click on Chart

Above is a chart of $USD from stock charts, which is the US Dollar Index. I was just going over it for myself, but by the time I had a bunch of boxes on there, I thought I would just post it as well. For a quick recap of basic intermarket relationships, at least during this bear market, but fundamental in some ways as well.......

-The USD typically trends opposite to gold and oil prices, and commodities in general.
-During this bear market, the USD has had pretty strong negative correlation to the stock market. Major stock bottom have been at major USD peaks.
-A falling USD is basically inflation, and a rising USD is basically deflation/credit contraction

So when trying to decide what one market is telling you, if it is not clear, it can help to look at other strongly correlated markets to see if it is any more clear.

I posted a video on June 1st discussing sentiment on the dollar and Euro and the possible elliott wave patterns that were forming, and suggested a bounce or trend reversal was imminent in the dollar. Well the bounce came, but there is no way I can conceive of it as a trend reversal. I had suggested that if the downtrend completed at that time, then we were probably in the midst of a triangle before another huge move up in the dollar. I also suggested that we could be seeing a "flat" elliott wave pattern, and that is what seems to be most likely as I type this today. I won't go into all the details because most of them are on the chart above. Probably only interesting for anyone with EWT background.

Also, the nearest futures contract for the USD Index (and also the UUP, strong dollar ETF)
did break below the June lows today, but the cash index did not. However, the nearest futures rallied to close above them and formed a hammer candlestick. The UUP formed a bullish engulfing pattern. These divergences between nearest futures and cash indexes can often be telling and a form of divergence or non-confirmation. I would think that this is bullish for the dollar and bearish for stocks and commodities.

I think it is possible that the USD dollar bottomed today from the technical reversal, a doji formation at support, and today met some typical and minimum requirements for relations between waves 1 and 5. Now as a matter of logic, IF the above is generally correct, then after wave 5 bottoms, it must completely retrace itself in equal or less time than it took to form. So that's what I am watching for (for confirmation) in coming days/weeks.

The biggest negative I see in the analysis above is that wave 3 is not 161.8% or more than wave 1. The extended wave in a 5 wave advance should typically be at least that. However, everything else fits, and I don't see another good interpretation.

Hanging Man and Dragon Fly Doji


Click on Charts to Enlarge

All the notes are on the charts. All three major index ETF's showed textbook reversal candlesticks today. They are not the "strongest" of reversal candlesticks, but taken together with chart based resistance and overbought indicators, they should be paid attention to. In order to get some confirmation it is nice to see a gap down and a close below the open tomorrow. In fact, if there is no lower close tomorrow, then those tricky bulls probably took one of their guys and dressed him up in a bear's suit to act as a decoy.

The Russell ETF, IWM, also showed a somewhat odd Bearish Belt Hold today. It gapped up and sold off immediately and closed almost unchanged from yesterday, but down slightly. The gap being sizeable and the lower close should give weight to this pattern, but there is also a signifcant lower shadow, which is not really part of the classic pattern. I don't know that I've ever read anything in regards to how significant that shadow is on a belt hold pattern. In any case, that pattern is not more than medium reliability. However, the Russell has not made new highs for the rally, so there is still some measure on non-confirmation in the indexes this point.

Capitulation?

Earnings beats. New S&P 500 closing high for the rally. Recovery talk. Nasdaq up 9 days in a row without a pause. Short-term bears are switching teams.

From a contrarian point of view, this sounds exactly like a market that is topping, not a market that is breaking out. Euphoria and shake out of all weak bears. When you look at candlesticks, each one tells a story and you can view a chart in terms of battle lines (resistance/support levels from gaps and prior significant highs/low) and battles that occurr on those lines. You pay close attention to who wins the battles at those lines.

Since yesterday the S&P made a new closing high for the rally, I thought the best chance for bears to hold would be on a gap up and engulfing pattern (sell off to close below yesterday's open) today. The fact of the new closing highs will draw a lot of media attention, etc and often result in a significant influx of less than savy money with market orders going into the next day's open. Also in this case if the gap takes the market above a prior high, you are assured that stops will be at those levels and the new high will really clean the slate by triggering the last ditch buy stops. We saw that this morning it seems.

While only at the close today will we know what candlestick is forming, today looks like it has a good chance for a bearish engulfing or dark cloud cover. Since this is occurring right at a major resistance area, a reversal candlestick pattern should be taken very seriously.

More to follow today or tomorrow on trade follow-up action for SDS and BGZ.


Pete

Monday, July 20, 2009

Gaps and Bases - SYMC and AAN

Click on Chart to Enlarge

The chart above is AAN. It has earnings tomorrow I believe. I wanted to post a few charts looking at how to interpret gaps and factor that into your analysis. AAN shows a couple decent size gap ups off the Nov low, with the first never being filled and the second one acting as support on the subsequent declines. Then in April there was a huge volume gap up which has been acting as support on the recent pullback. The decline after that gap makes a double bottom kind of base if you are familiar with Investor's Business Daily names for bases. Big gaps like this should either not be filled during a stock's run, or they should at least act as a support area. So look at the charts for the notes, but this could be a possible breakout play to buy the stock. However, any move below the recent low should negate some positives of the pattern.


Click on Chart to Enlarge


The chart above is SYMC, Symantec. This chart shows a monster volume gap down in May which looks to be a breakaway gap down. Gaps of that size and volume will typically not be completely filled on a subsequent rally. However, an ideal shorting opportunity can occur when price moves up into the gap area with an ABC type of correction. A stop would go 1 penny above the high in May. Also, as per IBD suggestions for shorting, first and foremost you want to see the market in the early stages of a correction to consider shorting. That is debateable right now, so it may be worth waiting for how IBD suggests entering, which is on a large volume (volume > 50 day MA) close back below the 50 day MA and then put a stop no more than about 7% above your entry.


Other stocks with pretty good looking breakaway gap downs are GRMN and WAG. So anyone interested could look further into those charts if interested in shorting.


This weekend I went through the charts of all 500 S&P 500 stocks to try to gauge whether this recent rally is an exhaustive type of move or a breakout type of move. I didn't come to a solid conclusion, but I found quite a few stocks that look set up for major longer term reversal from a pattern analysis. On the other hand, there are many stocks breaking out above recent highs on heavy volume. They are well extended from any type of longer term low risk buy point or from any type of major basing pattern. So while strength is strength, I don't know how long it will last.


There seems to be a major disparity right now in view points on the market. From reading comments on a bunch of blogs, there seems to be such a panic among bears and even several who decided to go long the last couple days, that this may be a last major shakeout of bears before a major decline. There are both Mega Bears or Mega Bulls right now, and the synthesis of the psychologies makes for a very uncertain consensus in the retail trader's mind from my take on it.

Friday, July 17, 2009

A Bug's Life

Click on Chart to Enlarge


This is certainly a pivotal and emotional time in the trading world. There is lots of frustration and even anger out there regarding the market and retail traders' emotions from both bulls and bears.

Bulls are mad that lots of people have been saying the market is likely to fall and keeping them out of this explosive rebound. Bears just cursing the rally and its descendants on every up tick. I can vouch for the frustration as well this week. "Sometimes you are the windshield, and sometimes you are the bug. And this was a bug kind of week for me" was how someone phrased it. I was definitely 100% long on bug genes this week, with full margin to boot. lol.

With short-term trading you have to be flexible and largely distance yourself from any belief or hope about the market. So while from a charting and pattern perspective I still favor this area as a topping/reversal level for the intermediate term until proven otherwise, a breakout and hold for several days above the June highs will be good reason to continue treating the intermediate trend as up until proven otherwise.

Here are a few links to other posts I've made highlighting some doji candlesticks for those interested.

http://stockmarketalchemy.blogspot.com/2009/03/doji-candlestick-in-major-indexes.html

http://stockmarketalchemy.blogspot.com/2008/09/nem-and-many-other-gold-stocks-reversal.html

http://stockmarketalchemy.blogspot.com/2009/06/shooting-stars-and-dia-northern-doji.html

http://stockmarketalchemy.blogspot.com/2009/04/doji-candlestick-friday-in-dow-and.html


Have a good weekend!

Non-Confirmation of Nasdaq and S&P 500/Dow.....Which Side Will Win?


Click on Chart to Enlarge

There are several things probably worth showing today, but I am going to limit it to the 2 charts above. The most important is the top chart which shows the S&P 500 in the upper pane and the QQQQ/Nasdaq in the lower pane. The important thing was that yesterday the Nasdaq made a new high for the rally but the S&P, Dow, and Russell did not. This is called a non confirmation where some indexes do not confirm the new high (or new low) in other indexes. The key thing here is that this particular occurrence has happened at every major turn down from the 2007 bull market high to the bear market bottom to date. The chart above shows the non-confirmations at every bear market rally since 2007. So while price is in bullish configuration relative to moving averages, it would take the other indexes making and holding new highs to really be technically convincing that this rally will/may continue.

The lower chart shows a 60 min MACD of the S&P 500. It has just made a bearish cross. If you looked at lower time frames you would see bearish divergence on the 30, 15, and 5 minute time frames. Also there is minor divergence on the 60 min stochastics. From that perspective, this appears to be a good time to consider bearish trade if not already positioned. For the blog we are already positioned, so please don't average down unless that was allowed in your orignal money management plan when entering the current trade. A stop should go at a level corresponding to yesterday's highs or at the June highs depending on how loose or tight is comfortable.

For interested chartists the Russell ($RUT or IWM) Index is showing a nice head and shoulders pattern currently. I have a suspicion of what is occurring in the other indexes, but at this point, we have to see major price declines in the next 2 weeks to confirm a top. After the June highs, the S&P never made a faster retracement than the previous rally. That is the kind of action that really tells you that the psychology has shifted, and it is the kind of thing that will need to happen if the market is indeed making its last gasp this week.


Pete

Thursday, July 16, 2009

Broken Record


Click on Charts to Enlarge

About the only thing I can offer right now is objective indicators to guide decisions on the current trades. Obviously no objective exit signal has come for the current SDS trade. In times like these when I am already positioned, I try to step back and just look at what is objective and decide if I would be a buyer or a seller or neither. Looking at the indicators above, I would definitely strongly consider being a short-term seller of the market at this level. For the first time this week, we are seeing divergences across the board from basically every indicator that I typically track. The chart directly above is the S&P 500 (30 minute chart) with stochastics, RSI, and DMI indictors. RSI and stochastics are overbought and sharply divergent on this afternoon's highs. The ADX line, which gauges trending movement, has peaked and rolled lower for several bars and the +DI line is showing a divergence on the afternoon highs also. The top chart above also shows that the trading model (STEM.MR), as well as intraday TICK and another type of price oscillator are all divergent on today's higher highs as well. These divergences are typically the best/strongest signal, and as the markets are at/in major resistance zones from an indicator perspective I don't see a good reason to not still suspect some measure of pullback very soon.

There are certainly some bullish factors here in the market and for blog trading purposes I am neutral, and will just primarily be looking at future signals in terms of where price and the signal occur relative to the previous signal to determine the best direction to trade.

As a non-objective side note, the last couple days have been the first time since early January that I really have felt a strong (negative) emotional reaction to the market action based on my current trades, etc. That was also the last time that I suggested a blog trade that went relentlessy against the trade for 3 straight days before any meaningful pullback. Being a contrarian by nature I tend to look for, and often trade, reversals earlier than (in hindsight) would be ideal. That was the case in January as well, when all the data and patterns suggested that the market should be topping. Shortly thereafter the market did roll over strongly as I suspected but the blog trade resulted in a loss of about 2% when said and done.

I do try to take mental, and often written, notes on any emotional response like this to help learn my own boiling point. So I am wondering if maybe this is a similar last hurrah as the market appears headed for higher highs only to roll over. So, I still am not exiting the SDS trade because I have no objective reason to.

Anyway, I gotta run, so I am trying to take any learning experience away from the current environment and trying to let the indicators be the judge rather than my feelings. I do expect a loss on this trade, but that is trading. I just am willing at this point to see if it will be a smaller loss than the current paper loss.

So Far Narrow Range Day at Major Horizontal Resistance - Looking For A Failed Breakout to Safely Maintain Current Trades

Click on Chart to Enlarge

At potential major turns, posting will tend to be much more frequent because each day carries important information, so sorry for the overload of posts.

Any how, as mentioned last night, I expected today to potentially be a narrow range day, and so far it has been just so. The chart has all the notes, so just check that out. The main focus is whether price breaks down or up from the test of the first swing high after the June 11 top.

Wednesday, July 15, 2009

Bears Are Soiling Themselves........Not Me.......Other Bears (I already soiled myself around 3pm ET today)


Click on Charts to Enlarge

Despite anti gravity action in the market I don't have much to say. There are any number of cliches or analogies I could say here, but the bottom line is 1) the market is always right, and 2) there is has been no exit signal yet for the latest trade so there's not much to do.

The top chart above is the end of day short-term model I use for trades. This reached the highest level in its history (since 2002) during the day today. Check the comments section of today's earlier post for some background on other occurrences. Basically the other instances occurred near (just prior to major tops) or on the first explosion out of a major bottom. We certainly aren't in the second scenario, so on those grounds I would say we are probably in the first scenario.

The second chart is a longer short-term model composed of some different data. Only limited history is visible on the chart, but same story....happens coming off major bottoms or near significant peaks. Other than this March, all other signals led to almost immediate significant pullbacks.

The bottom chart is intraday cumulative TICK for the NYSE. Again this is the highest it has been in months (highest visible on the chart). Corresponding major highs typically lead to immediate pullbacks, or a narrower range day, followed by larger pullbacks.

From historical backtesting of prior major strong breadth days like today (last 3 days really), there are some clear guidelines for tomorrow. Downside risk is significantly larger than upside potential. Any gap down is extremely likely to be filled during the day. Expectancy is lower than random, due to losers being much bigger than winners.

From my experience after days like today, I expect to see a narrow range type of day to digest things, then expect the market to give back some recent gains following over the next few days. The associative cortex of my brain is telling me that I last felt like this around Jan 5 of this year. While the market is certainly in a different spot right now, I wouldn't be surprised if these price levels are not seen again for many moons after this week.

Pete

Thinking Through Recent Expectations, And How to Judge The Recent Rally

Click on Chart to Enlarge


First off, as stated on the charts above (and as I've said before), I put projections like this on my charts and on the blog, because that is how I think and am able to get a handle on whether my outlook is basically in line with reality or not. It helps me beforehand to know what I am looking for, and where and when I will go with or against a trend. If things don't follow expectations at all, then I basically just use moving averages and any reliable sentiment extremes to filter out good trading opportunities. So no one has a crystal ball....that is not why I use projections and patterns, but to the extent that it helps the bottom line and confidence of when to hold em and fold em, then it is valuable. Also, with continuous and rigorous application of logic/objective principles and standard price patterns, in my experience you can occasionally rule almost any scenario out except 1 and make a large gain (particularly with options at major turns).

I have put some links to recent posts, just to start weeding out any scenarios that are not fitting, and carry over any concepts that are.

June 21st

June 29th

July 6th

July 8th

First off the head and shoulders topping pattern is in question (see June 29 post). The market has closed several days above the neckline and made some major gains. However, notice the projection I had in that post for a decline and another rally to produce ideal symmetry of the pattern into this week which for a few reasons may be a "cyclical" turning point. Also if you were to filter out the noise of intraday highs and lows and just use a line chart currently, the S&P chart still shows an almost perfect head and shoulders pattern. Granted there were a couple closes below the neckline on the right shoulder, but I don't know objectively whether or not that weakens the pattern.

Secondly, in reference to the July 8 post, the market did not continue down after that post, so that scenario should be basically ruled out as it was based on the idea of an expanding pattern where each leg down of the new trend is longer (in % terms) than the last. So looking at the current chart, there is certainly an expanding bias right now. So maybe we get a big move down
that looks like an expanding triangle. But I think it is more likely that we get some continuation of rangebound behavior without a major breakout either way for a couple weeks.

In reference to the June 21 post, the market has been holding well above the typical rate of descent angles for a typical bear market leg down. So either it has some MAJOR catch up to play, or more likely the current pschological environment has not made a shift back to bear market mode.

Now in reference to the July 6th post. With the head and shoulders in question, and at this point continued range type activity, I think I have to expect any move down in coming weeks to the top of the target area there to initially be met with support.

So right now the big question is whether the move this week is the signs of a new major leg up, or just another sellable bear market rally. As discussed briefly last night, the type of breadth and indicator readings generated yesterday seems historically to either happen as a final euphoric move before a major high, OR they are the first explosion on a major move higher after a major low. Sentimentrader.com this morning showed a simple litmus test to gauge which one we are likely to be seeing. Basically if the market is above current levels by next Wednesay's close (1 week) then, based on historical comparision, we are likely in the midst of a significant move higher in coming weeks. If we are negative over the next week, then this is probably a top of significance with downside risk greater than any upside potential over the next several weeks or even months.

So that is my perspective currently. I may make a post a coming days showing "The Slosh Report" which is basically tracking liquidity (short-term loans) expansion or contraction by the Fed and how this may affect the markets. Maybe not co-incidental is the market's inability to sustain higher prices as liquidity moves by the Fed have been turning from expansion to contraction over the last couple months. It also appears that further significant contraction will be occurring by the end of July.

Using Stochastics On Multiple Time Frames


Click on Charts to Enlarge

This post is just for educational purposes. It will be showing stochastics on several time frames paying attention to a extreme readings on several time frames occurring at the same time. The top chart is a daily chart of QQQQ. Of note is that this morning the RSI(3) is above 90. I have highlighted past instances with light blue vertical lines. What we see is that this has typically occurred just prior to significant peaks in the market with the downside risk being large, and upside potential being very minimal.

Also, I have put a small pink line showing that the gap down from July 2 has been filled as of this morning. From a swing trading perspective, in this case looking to go short, I like to see overhead gap downs filled to remove some risk due to tendency for gaps to fill within the first few weeks after forming.

The charts below are of SPY, not QQQQ, but they all look similar. The next chart is a 60 min chart with stochastics underneath. We see that it became overbought yesterday (pay attention to the red line). Now the blue line is actually lower than it was the last couple days despite the large move up today. So this is a first hint of divergence on this time frame.

The next chart is a 15 min chart of SPY. The stochastics underneath is overbought on this time frame as well. Additionally, while price has made significant new highs the last 2 days, the stochastics peak (red line) is only at about the same level. So while it is not clear yet, this may end up showing somewhat of a divergence.

The bottom chart is a 5 min chart of SPY. Again the stochastics is very overbought. You could also look at a 1 min chart as well, though that would only be at all necessary for a day trade.

The point of this is to show that when cycles from multiple time frames are all extended it is often possible to enter based on a short-term chart like a 5 or 15 min with a narrow stop based on that time frame, but it may be possible to hold for a longer swing trade for the exit (exit with the 60 min chart or daily RSI(3)) if you get immediate confirmation and don't get stopped out. It is certainly possible to get risk/reward ratios upwards of 10 to 1 at times like these. Now granted you may get stopped out a few times, but you only have to be right 1 out of 10 times to be profitable in the long run.

In this particular case, I would probably wait for the 5 min chart to come down and then give an overbought signal at a lower high befor entering for a potential swing trade. Then set the stop above the high of the rally.

Now, it is not worth beating a dead horse on the current SDS blog trade. At this point, the best course of action is to simply wait for the exit signal to come and take the result win or lose. The market is extremely overbought short-term. I can't remember the last time the short-term model was this overbought (maybe January of this year, but I'd have to check the data). Also cumulative intraday TICK levels are thru the roof. So either the market will put on the rocket boosters and go to the moon, or more likey, mean reversion will kick in over the next week or so and bring prices back down a good bit. It has been a rare past blog trade where the market makes this much headway against the trade before reverting. In those cases, when the exit signal comes, it tends to result in a near breakeven trade, maybe with a small loss (small relative to the average winning trade). It is still certainly possible that this trade ends up with a profit, but it would probably take a decent/large size gap down or two before the exit signal, to be able to have anything more than a small win.

Now on a side note, the middle of this week should be a cyclical turning point. In a recent post I had suggested/projected that it may be a low point before a substantial rally. However, the move up since then makes it more likely that it will be a cyclical high (if this time frame does prove to be an inflection point). While it will only be relatively clear in hindsight, currently I believe the best two interpretations of the current price pattern both suggest very substantial downside for the next 1-2 weeks.

Tuesday, July 14, 2009

INTC Set to Gap Up Tomorrow

INTC traded up about 7% on earnings after hours today. So it seems almost certain that the QQQQ's will gap up tomorrow due to the weighting of INTC in the index. However, past large INTC gap ups on earnings have tended to be decent/good short to intermediate term contrary indicators. In the past, the QQQQ's have often closed well below the open in this situation. When the markets gap up, particularly large ones, while in the short-term model is overbought (which it is extremely in this case), that also often results in the gap closing below the open.

Gaps like that can really squeeze short positions and worry those who are betting against the rally....(cough cough). So while it is not always easy to emotionally tolerate such a situation, past experience suggests that waiting for the market to exhaust itself to the upside and give the next oversold signal is the way to go for exiting the current SDS trade.

Also of note, a few ways of looking at the VIX (relative to its 10 day average and relative to VIX futures) are showing that the VIX is due to move up (and the market pull back) based on past tendencies. Also the VIX/VXV ratio has continued to decline the past month or two, never yet giving a market buy signal to reverse the sell signals I have noted in the past few months. Another extremely low reading (0.85) registered today which is basically even with the lowest reading since the inception of the VXV. The prior low was right at the market peak of May 2008.

Just to clarify, I am not at all suggesting to short INTC tomorrow. But I do think it is wise to let any gap play out and wait for the next objective oversold signal rather than making an emotional exit on the current SDS trade.


Pete

Monday, July 13, 2009

Quick Look at SPY - Over Bought Below 20 Day MA

Click on Chart to Enlarge


Here is a quick view of SPY after today's close. Overlaid on the chart are bollinger bands/20 day MA in blue and the 200 day MA in red. SPY bounced off the 200 day MA last week. I don't really care about that MA, but lots of people watch it, so I put it there to help illustrate the tug of war in this area. Price is stuck between the 20 day and 200 day MAs.

For the blog I mainly use the 20 day MA to help gauge the "safest" direction to trade. You can see on the chart that it is pointed down now. It is the dotted line in the middle of the bollinger bands. I have put some vertial light blue lines on the chart as well showing times when the 3 period RSI was oversold with the 20 day MA pointed up, and also the most recent line today shows the RSI(3) overbought with the 20 day MA pointed down. I didn't highlight those set-ups where the average was basically flat. You can see how quickly the market has tended to resume the direction of the 20 day trend once it gets short-term overbought or oversold.

It is very common for a breakdown out of a head and shoulders top to come back up to the neckline to "back-test" the breakdown price. That is what I view today as. Price did close above the neckline, which is not necessarily ideal from a charting standpoint, but as long as price quickly falters from these levels, I don't view it as a good reason to dismiss the H&S pattern and price targets for general guidance.

On a side note, I am going to use 57.85 as the blog entry price for SDS which is the average of the limit order and the signal entry posts from today. Also SDS spent the most time between 57.75 and 57.85 for the first hour or two after I posted the entry. So basically, going from the posts, you almost could not have got in even as high as 58.00, so I bumped the entry price down a few cents.


Pete

SDS Trade Entry

The limit order of 57.70 on SDS has not been hit yet, but the short-term model just touched the overbought level. Today has a trendy look for stocks, so the market may move higher and fill the limit order, but I am going to post the entry now at 58.00 and consider the trade active.

Pete

Limit Order for SDS Trade

The short-term model is approaching the overbought region though it is not there yet. The price movement since the middle of last week looks like an ideal "abc" backtest of the neckline of the head and shoulders top, and is a place that I would have no reservations whatsoever about taking a bearish trade from a charting perspective. This was what I envisioned as the ideal next blog trade, so until proven otherwise, I think any overbought signal here, could provide a great trade entry on SDS.

The price level that I was looking for on SPY has already been hit, so I think upside will be limited in the markets, particularly on a closing basis. I am going to suggest a limit order to buy SDS for those who like/need limit orders, but as always I will post the entry if/when the signal comes even if the limit order is not filled. In that case you may need to cancel the limit order and just enter with a market order when you have time.


New Trade Recommendation:

Place a "day only" limit order to buy SDS at 57.70 or better.


Pete

Saturday, July 11, 2009

Eyeing Up Exit for BGZ and Possible Bullish Trade

Click on Chart to Enlarge

For the first time in a while, the balance of market indicators is tilting toward oversold for the short term. So the stage is setting for a more sizeable bounce (tradable for blog purposes). But the lack of the ability to make a good start on it last week makes me believe there will be at least one more push below the recent lows to really build up enough interest for it to occur.

The target of the head and shoulders pattern is 825 by standard measurement. I don't think the market will fall that far this week, but if we approach that level, even the 840's, and the short-term model becomes oversold, then I will very likely suggest a bullish trade for the blog. Also, I will likely use any such scenario to exit the current BGZ trade. If so, I will be wanting to re-enter BGZ after any sizeable short-term advance. I will post more about that if such a scenario does unfold, but for now, expect the possibility of an exit this week.


Pete

Thursday, July 9, 2009

Back-test of Head and Shoulders Top?

Yesterday the market made a nice afternoon reversal. The candlestick pattern looked very nice, so we may see the market rebound further, but in the context of the head and shoulders pattern, this may be a simple back test up to the neckline area. The S&P 500 fell below the important 878 level which was the first major support from the prior rally. As discussed in the past, there were likely lots of stop orders below that level. So we saw those stops cleaned out yesterday and then some buying interest come into the close. I expected to see a gap up this morning, and we got that, but the strength since the open has been only modest.

Right now the 20 day MA on SPY is pointed down and the bollinger bands are channeling with a downward angle. That is generally a sign that the safest trades will be bearish ones. Until we get more signs of intermediate term capitulation, it is probably wise to focus on bearish trades.

Despite only modest strength today so far, it is possible that we get an overbought signal from the short-term model before the close. Since volatility is still low, but the 10 day average is pointed sharply down, it will not take too much to get overbought. So you may want to check back before the close for any new trade possibility.


Pete

Wednesday, July 8, 2009

Possible Pattern Expectations

Click on Chart to Enlarge

The market has not responded well to short-term oversold indications the last few days. There should be no doubt now that the intermediate trend is down. As more time and price action unfold, I can begin to propose possible scenarios that may unfold from this point.

The chart above is my best approximation of what may occur over the next 5 or 6 weeks. I think a move down toward the target area for a head and shoulders top may occur as we approach options expiration, followed by a rebound into the end of the month. Assuming that the S&P falls below 855ish on this move down (this week or next), then I think that the next leg down will be even worse, with a mini "crash" in mid August being a distinct possibility.

If/as we approach that head and shoulders target, it will probably be wise to lock in profit on BGZ and exit if/when the target area is reached. So the next trade modification for the blog will probably be a stop placement on BGZ. If the target zone I posted a few days ago is reached with several signs of short-term exhaustion, then I will be willing to try a counter trend (bullish) trade on short-term oversold indications.

Also, I have had a link up for a week or so to the options blog I started, OptionsAlchemy.blogspot.com. So for those interested in options, you are welcome for the time being to follow along with that blog. For anyone still "new" to trading in general or inexperienced with options, it would be a good learning experience to set up (or your broker may have one) a paper/virtual trading account to perform and track the trades for practice. I am not going to go into a whole bunch of detail here, but that blog will be handled very "aggressively", certainly not suitable for one's entire account. If anyone wants any ideas about money management for options trading (which is the most important thing for long-term success), please leave a comment with specific questions and we can exchange some ideas.

I decided on an aggressive "challenge" type format to make it maybe more interesting to follow. As a rule of thumb, the maximum of a trading account anyone should devote to options trading would be about 20%. And that number should be 0% until you have good understanding of basic options strategies and conviction in the profitability of the strategies used. Sticking to equity/ETF trades will probably be the best choice for most people, but if anyone wants to copy those trades, you should probably devote only about 1-2% of your account to any out of the money trades, and about 4% to in the money trades. If you don't understand what is "out of" or "in the" money, please don't trade options (yet).

While this is already more than I planned for this post, understand that trading is about risk vs. reward. In options your risk and your reward will both be greater. So why trade options? About the only real good reason is because you can devote a very small amount of your trading account, to potentially get the same $ gain as you would with a much larger amount of money in equities. In that sense you have "limited risk" due to less capital exposure. However, statistics show that most option buyers lose money in the long run, so unless you know from experience that your methods should be profitable, then you probably shouldn't buy them at all.

Option selling is a whole different game, but that is not my area of expertise, and no sell to open trades will be done on my blog.


Pete

Tuesday, July 7, 2009

General Update

As discussed yesterday, yesterday proved to indeed be a false reversal type move off the neckline of the head and shoulders top. That does not mean the market cannot still bounce from here. However, once a head and shoulders top breaks the neckline, a solid pattern will not typically see any close back above the neckline. A back-test up toward the neckline is very common and may be expected with how oversold some short-term indicators are. So from a traditional charting standpoint, that is what we should be watching for - does price hold below the neckline on a closing basis?

The short-term models of both the S&P 500 and Nasdaq are oversold after today. When this occurrs, it will often lead to a bounce in the market, if only short-term. So from my vantage point, we should expect the market to bounce without much further decline. If it does not, and price continues to fall, that should be a clue about the market's (lack of) strength in the coming weeks.

In sum, there are several short-term oversold indications, but in my view it is too dangerous to attempt a short-term bullish trade here for the blog. For a very nimble trader, I would certainly think you could go for it if the indicators look good and you have a sensible stop, but I want to stay focused on the very high probability trades for the blog so that perfect timing is not necessary to make a good trade.

It is still a little bit too early to put a stop in on BGZ right now I think. After a good deal of patience, it has come our way, but not enough to create a breakeven scenario with very little risk of stopping out on an otherwise good trade. While for short-term traders it is hard not to exit at a time like this, all indications are that the intermediate term trend has shifted down, and that the biggest portion of the gains are likely ahead of us yet. So the intent of the trade has been and still is to go for a bigger gain and begin honing in on an exit when the target area I showed yesterday is reached.

Monday, July 6, 2009

Some Projections for This Decline

Click on Chart to Enlarge


The chart above is the S&P 500 with several notes and a target zone for either the bottoming area of the first phase of a larger bear market decline, or possibly a right shoulder on a large scale head and shoulders bottom from Nov 2008 to present (and beyond). The target zone is actually derived from past bear market bottoms and the corrections that followed them. So this would actually be most applicable if the March 2009 low was a bear market low. I don't believe it is, but in either case there are several other factors which suggest this is a very reasonable, albeit somewhat broad, target zone which I am eyeing for potential exit of the current BGZ trade, and possibly as a time after which to consider some bullish short term trades.

Today was interesting in that the market fell below the neckline of the head and shoulder top pattern early in the day, but reversed to close above it. This is not unexpected, however, I also don't think that anyone should get too bullish, even in the short-term, because of this. I can think of plenty of times when bulls (or the reverse as well) were looking at a certain area for a false breakdown, and the market obliged by giving a nice reversal pattern, only to quickly fail over the next couple days. As I had mentioned last week, this neckline area is probably a "bait" area for bulls, with the larger context remaining bearish.

At this point I have almost ruled out the idea of taking any possible bullish trade this week, though another push to new lows with a bunch of short-term divergences could change my mind. However, any trade of that nature would require a stop loss from my perspective, due to the counter trend nature of the trade.

I don't know right now what to expect tomorrow, but I am leaning toward a tomorrow being a down day at this point.

Just a Reminder on the Last SDS Trade

This post is just a reminder to exit the most recent SDS trade if you did not late last week. While the S&P may continue to break down from here, if not, there will probably be a strong rally. In any case, the exit signal has come, so anyone that got in should be getting/(have gotten) out.

Sunday, July 5, 2009

For Monday July 6th

I will probably be visiting with family most of the day tomorrow and Tuesday, so I don't know the likelihood of any new blog trade even if there is a good set-up. But here's my take from seeing some historical stats and the technical set-up......

If the market opens with a gap up tomorrow, that may suggest strength the rest of the day, with the best short-term opportunity probably being a gap up followed by weakness undercutting Thursday's low, followed by an intraday reversal type set-up to go long. I am not recommending this at this point, but that could be a decent set-up.

If the market opens with a gap down after such a big, broad-based downer last session, that has historically suggested that the selling has not run its course yet, and I wouldn't be very willing to take much less than a "perfect" bullish set-up. The S&P short-term model is oversold already, and the market is above support, so the set-up is decent. But with a fairly obvious shifting of trend to the downside, I may not even bother trying to catch a bullish trade.

The fact that the high of the left "shoulder" was exceeded last week on the S&P makes me less expectant of a secondary bounce here before breaking the "neckline" of the head and shoulders type pattern that is forming. For the ideal symmetry of the pattern, it would still need to bounce again, but it may not be worth trying to catch for blog trading purposes. I'll have to see what it looks like, and if I have enough time to devote to sizing things up the next day or two.


Pete

Thursday, July 2, 2009

SDS Trade Exit

The S&P short-term model did just reach oversold territory, triggering an exit for this SDS trade. The current price is 57.75 which will be the blog exit price, up nearly 4%.


Trade Action:

Exit the current SDS trade today with a market order, or ASAP next week with a market order.


Pete

SDS Update

There is a decent chance that the short-term model may become oversold today after the pronounced weakness so far. It will probably require some more downside, but that certainly could happen. If anyone is away for the afternoon, then I would put in a limit order of 58.00 to potentially sell SDS on further market weakness. However, I will post if/when the signal actually comes and use that price for the blog exit.

If not, then have a nice holiday weekend!


Pete

Wednesday, July 1, 2009

SDS Trade Update

Click on Chart to Enlarge

The chart above is a screenshot of the short-term models I use from Sentimentrader.com for blog trades. The left side is the S&P model with the heading STEM.MR MODEL. The right side is the Nasdaq model. Also underneath the models are the cumulative intraday TICK for the NYSE and Nasdaq respectively. The cumulative TICK is the sum of the closing TICK values of the last thirteen 30-min periods.

Notice that as price has pushed into modest new highs on those indices since our entry on Thursday, both the short-term models and the TICK data are not reaching new highs. This is setting up a bearish divergence. Divergences work in this model in a similar way to traditional technical analysis.

With the long-weekend coming up, I would guess that tomorrow will be a lackluster mover, so there will probably be no potential exit until next week. There were a few subtle but notable happenenings from a charting perspective the last couple days in regards to recent down gaps being filled, and the high of the possible left shoulder being exceeded intraday on the S&P. This was followed with selling to bring prices back down a bit from those levels.

To sum up, I don't see much underlying strength in this move at these levels, and I doubt there is much upside left in it before a significant pullback occurs.


Pete