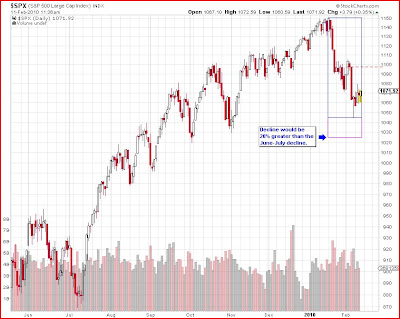
The chart above shows that as of today the current correction would be as long in time as the June-July correction. The pink box shows how low this correction would have to go to be 20% bigger than the June-July correction. I have talked about this concept before and that is why I am bringing it up here. The concept is that when a trend is mature, you look for a larger % and more time consuming correction to give you a great clue that the trend has changed. As of now, the current correction still "fits" in with the other corrections since March. But further declines below Friday's low would make it longer and larger and be better evidence of a larger trend change.
Other factors to watch on any continuation of this rally are the 50 and 80 day MA's above current prices (1100-1110). Those were support on the rally and may be resistance if this is a new downtrend. Also, there is an unfilled gap down on SPY at 109.80 which may attract and/or resist price. As of right now, the short-term model is nearing overbought levels and I will almost certainly post a trade if it gets there today or tomorrow.


No comments:
Post a Comment