 Click on Chart to Enlarge
Today the major indexes formed bearish reversal candlesticks across the board. QQQQ, SPY, and IWM all formed nice bearish engulfing patterns. Also, several other markets formed reversals too (more info below).
As per the last few posts.....almost all successful breakouts in the S&P above a prior intermediate high did not close back below the old high. So i noted that we should look for that as a first clue about the future direction of the market. Today the S&P 500 closed back below the April high, so that is a warning sign that the move up may not be sustainable. If you go through a lot of charts, you will see that a failed breakout will often lead to a sharp decline back below the low of the recent leg up. In this case that would be the Aug/Sept lows in stocks. Also, it often will happen faster than the advance. So, I can't predict the future, but I am just saying that from a charting standpoint, that would be relatively normal. Even if it seems absurd now, the possibility is reasonable.
Another interesting thing to note is that the recent high bumped into a geometric resistance line that also capped the advance in June before a sharp decline into July 1st (see the red circles above). Maybe this is meaningless, but I thought I'd put the line on the chart. The pink lines are some points of significance based on price patterns which I won't get into here.
 Click on Chart to Enlarge
As noted a few days ago, the US Dollar recently broke a pseudo trendline amidst the FOMC news and QE2 announcement. I noted that it may be an ideal reversal point for a bottom. Well it is back above the trendline and up 3 days in a row. There is a sharp bullish divergence on the RSI and MACD suggesting that price is bottoming here. Check the chart for further notes.
Why is this important? Because all markets are keying off the US Dollar, and it trades inversely to most other markets you may be watching like stocks, gold/silver, oil, etc. So if it has bottomed and starts up, it won't be long till stocks turn down, if not immediately. Also, remember that sentiment is super bearish on the US dollar, and so a major advance could be in the cards. Another interesting thing to note is that the US Dollar Index has made, as of now, a higher bottom than the one last year, while stocks have made higher highs. So there is a non-confirmation here that suggests stocks will turn down and the Dollar turn up.
 Click on Chart to Enlarge
This is a blow off if I've ever seen one. And the sentiment is uber-bullish to boot. This chart is the SLV silver ETF. The volume exploded to astronomical proportions and the range was >10% which swamps any daily range in a long time. In the end, it formed a bearish engulfing candlestick pattern. And the RSI is in a bearish divergence position. Get the heck out if you are in.
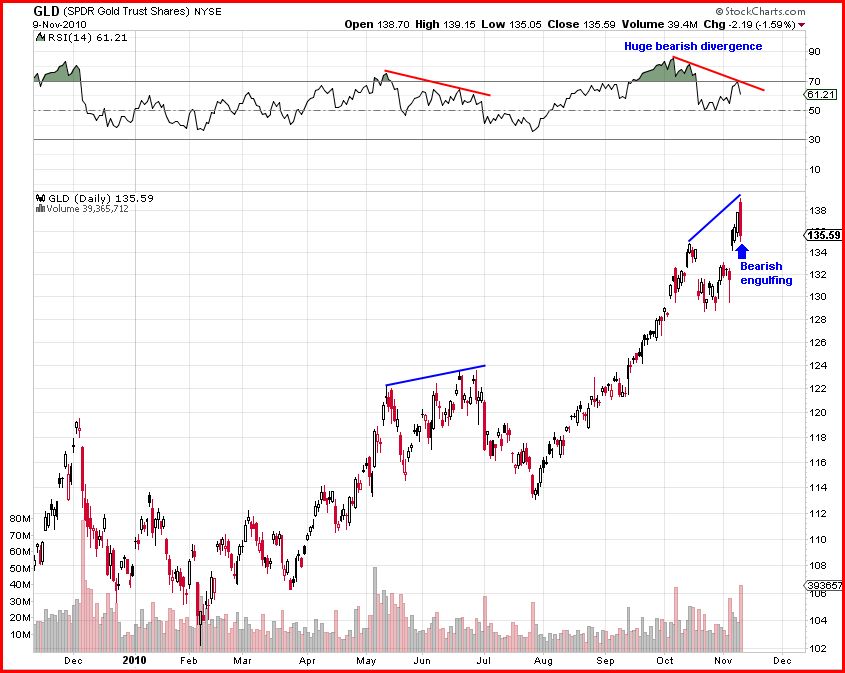 Click on Chart to Enlarge
The action in gold wasn't as dramatic but it also formed a bearish engulfing pattern, with an even stronger bearish divergence on the RSI than silver. If you look through the charts of gold and silver the last few years, you consistently see volume swell right at the tops. That is happening again. I think the odds of a correction in gold are very high.
As for bonds, the weekly chart of the 30 year bond interest rate suggests a major bottom may have formed, so the price of TLT or long term US bonds is likely to continue to fall longer term. Also there was a nice harmonic bullish ABC pattern that was set-up prior to today's decline. I take today's decline as a warning that the pattern may fail and that the longer term trend is indeed turning down in bonds. Also of note is that both stocks and bonds were down today. Most often they have traded inversely to each other. I have suggested for months that I expect there to come a time where that inverse relationship ends and both sell off in tandem. Maybe we are on the brink of that now.
But as always keep an eye out for bottoming signs in bonds. The daily RSI is almost oversold and so a bullish reversal candlestick may be respected. There is, however, no divergence on the daily chart technicals, so even if a bullish candle shows up, it may be best to wait for any rally and then gauge the first pullback from the rally to see if it looks like it will make a higher low, or if it will come down further to form some divergence.
Hopefully this helps. If you are on the fence on making decisions right now with trades or investments, my suggestion is still that one should get out of most everything except the US Dollar. Now that is exactly the opposite of popular wisdom right now, but that is all the more reason to do it.
Hello I agree about the dollar situation, holding Bgz at 10.85 as hedge, long Dg -on slower growth ahead,,Tal -solid global growth (add on dips) appreciate your feedback, thanks
ReplyDelete