 Click on Chart to Enlarge
The S&P 500 is in an interesting spot here. The equity put/call ratio several days back spiked suggesting we should see a rally, which we have to some extent, though abbreviated compared to past rallies after similar spikes. There was a decent follow-through attempt last Tuesday, but immediately met with a couple distribution days. IBD says that when you see this type of occurrence right after a follow through attempt, it is likely to fail. IBD also says that a healthy follow through day should have a number of leadership stocks break out of healthy bases. I don't think we saw that last week. Based off of that IBD model, this attempt seems prone to fail.
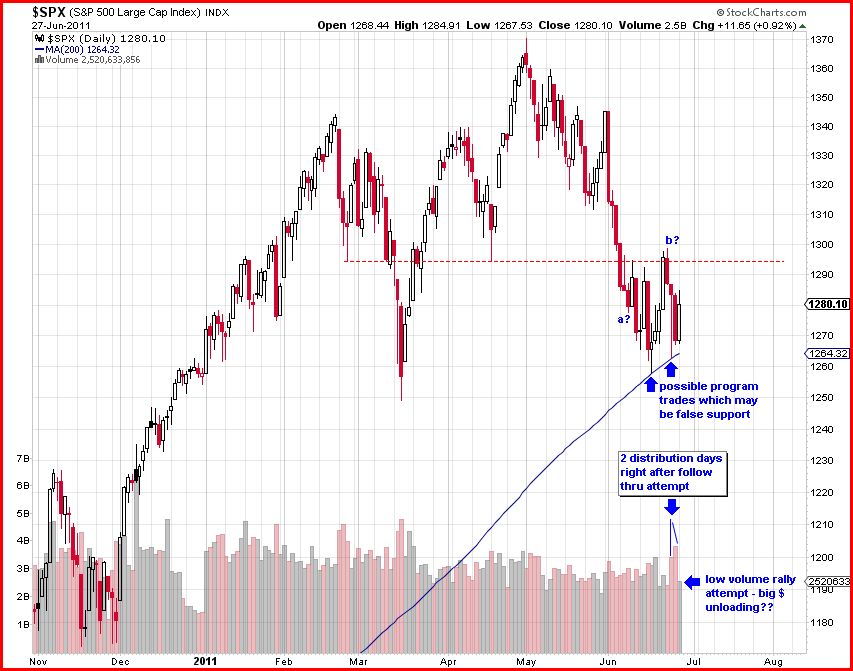
On the chart the rally was rebuffed at a prior chart support area at 1295 (dashed red line). Very interesting to me is the rally twice off of the 200 day SMA over the last few days. Because it occurred within fractions of a point of the 200 day SMA we can assume that this is largely program trading I would think. I have discussed this at various points in the past, but I believe that it is a frequent occurrence for the market to put in a false rally attempt at the 50 and/or 200 day SMA after a high is in. But beware when the moving average breaks after the initial rally attempt. Basically I see it as a short-term blip caused by algorithmic program trading using those MA's, but it is not a legit chart reversal. I take those reversals less seriously than one at a true solid chart support area.
Also I read that there was negative money flow today on the rally suggesting that large trade blocks (institutions) were net sellers on the day in significant fashion. Not what you expect on a healthy rally attempt.
No comments:
Post a Comment