Thursday, June 30, 2011

Stocks and Commodities

Click on Chart to Enlarge

Given the extreme put/call ratios at the end of this recent correction, history suggests a multi week rally. We may still be early in that, but the flip side, is basically when the ratios spike to that high, there is another new low in stocks before a more sustained advance. So sentiment peaks or hits extremes before price does, which creates divergences before major moves.

If that is the case and stocks move below the recent lows, then I think most of the price movement is already done to the upside. I like looking at the fast stochastics for counter trend movements. The chart above shows it is overbought on the daily time frame. However, it typically needs a few days to lose momentum before a pullback happens. Basically wait for the red %D line to go back below 80. Now if you look at a weekly chart with this indicator, you see it is just rising out of oversold territory. So it may be a situation where we rally/consolidate a bit more then move to new lows creating weekly bullish divergence before another major rally attempt.

Prices have now moved to the upper bollinger band suggesting prices are statistically stretched to the upside on the daily time frame. On the hourly time frame, there is no significant bearish divergence on momentum oscillators suggesting a significant high is not imminent. That would be the first thing to look for if looking to bet against the rally.

Click on Chart to Enlarge

The CRB commodity index made a nice looking bullish MACD cross out of oversold territory with strong bullish divergence. Now there are other reasons that I have been expecting a more significant longer term correction based on cycles, CoT data, and US dollar price action/ sentiment, but a signal this text-book just must be respected. Price trumps all.

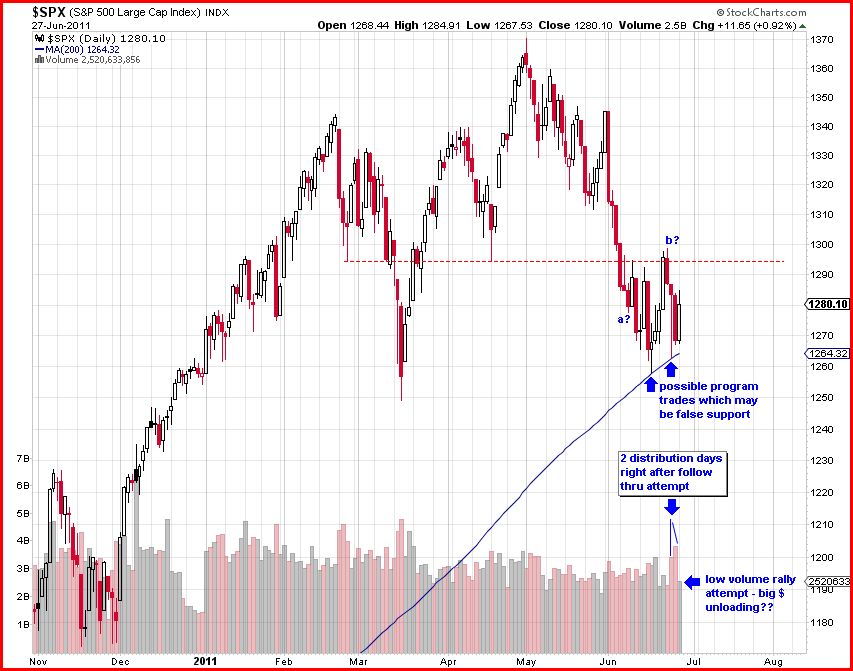
The price action has a nicely subdivided classic Elliott Wave structure which suggests and ABC zig-zag may be complete. To confirm this, price should be expected to retrace above the blue box (wave C) in less time than it took to form. If this doesn't happen, then we may be in a situation, where what looks like the C wave is actually the first part of a larger and more subdivided move (ex. we are in wave 2 and still have 3, 4, and 5 down to come). Or we could be in an "x" wave before another corrective pattern down forms. Basically I will use the price action relative to that blue box as a first clue to the possible pattern forming.

Another more subtle and subjective aspect of this pattern, is that the final advance before this correction looked (and had post pattern explosive behavior) like a "terminal" pattern or diagonal triangle in Elliott parlance. These patterns end patterns of a larger degree. If that is the case here, then by this metric we should see a larger correction of the entire recent bull market.

If you look at a chart of the S&P 500 during the last bear market, you will see the July 2008 low undercut the Jan 2008 low and had some bullish divergence. Prices rallied but when the rally failed and went to new lows, prices moved down fast. So the principle is that when a prior low is undercut like that, and price rallies moving above the old lows, it should be respected. But if the rally is weak and if it breaks to a new low, it can decline quickly. Any long positions should have a no wiggle room stop below the recent lows.

Wednesday, June 29, 2011

Cancel the standing limit order on SSO and sell with a market order on the open today. There is a sizeable gap up indicated on a news event in a short-term overbought market. We may see some selling after the open.

Yesterday was another lower volume rally which may be setting up a nice shorting opportunity in stocks, but also puts them close to a breakout of resistance on the S&P.

Tuesday, June 28, 2011

S&P 500 Update

Click on Chart to Enlarge

The S&P 500 is in an interesting spot here. The equity put/call ratio several days back spiked suggesting we should see a rally, which we have to some extent, though abbreviated compared to past rallies after similar spikes. There was a decent follow-through attempt last Tuesday, but immediately met with a couple distribution days. IBD says that when you see this type of occurrence right after a follow through attempt, it is likely to fail. IBD also says that a healthy follow through day should have a number of leadership stocks break out of healthy bases. I don't think we saw that last week. Based off of that IBD model, this attempt seems prone to fail.

On the chart the rally was rebuffed at a prior chart support area at 1295 (dashed red line). Very interesting to me is the rally twice off of the 200 day SMA over the last few days. Because it occurred within fractions of a point of the 200 day SMA we can assume that this is largely program trading I would think. I have discussed this at various points in the past, but I believe that it is a frequent occurrence for the market to put in a false rally attempt at the 50 and/or 200 day SMA after a high is in. But beware when the moving average breaks after the initial rally attempt. Basically I see it as a short-term blip caused by algorithmic program trading using those MA's, but it is not a legit chart reversal. I take those reversals less seriously than one at a true solid chart support area.

Also I read that there was negative money flow today on the rally suggesting that large trade blocks (institutions) were net sellers on the day in significant fashion. Not what you expect on a healthy rally attempt.

Sunday, June 26, 2011

CRB Downside Breakout

Click on Chart to Enlarge

The CRB commodity index broke the May low with a large gap and low close on Thursday. I mentioned that this should be taken as a longer term bearish signal given the context. The rectangle boxes are the same in price and time, so it may give an approximate target for how long this move down will last before another significant rally attempt.

There may be some initial push back here, but as long as the "stop level" shown on the chart holds, there is a bearish bias on commodities. Given the long lasting correlations over the past several years, this would mean stocks down and US Dollar up if commodities trend down.

Failed Rally Attempt?

Click on Chart to Enlarge

The chart above is the Nasdaq composite. I am showing this because of the chart pattern and because tech has been in a leading position since the beginning of the bull market, but it is now leading to the downside for the first time since late in 2008.

Notice the March low was exceeded slightly on the downside on this correction. That hasn't happened in the Dow or S&P. Also, the breakout at the April/May high was weaker in the Nasdaq than in those averages. This suggests weakness in the leading stocks and index. It is very common for a rally to occur after the break of a significant low like this. Basically there is a lot of pressure for short covering. As long as the reversal above this low holds it should be respected, but a break back below it will likely accelerate the decline to the next chart support.

This past week there was a follow-through type day on Tuesday (for those that are familiar with IBD methods). However, the Dow and S&P were well off the % gains expected on a follow through, AND there have been 2 high volume declines since then (distribution days) suggesting the rally attempt may not have staying power.

The CRB and CCI commodity averages have both broken the May lows which I noted in a recent post. This now suggests that commodities are likely to be in a weak position. We are likely to see the US Dollar advance and stocks decline if commodities do breakaway to the downside.

For growth stock buyers, I would suggest waiting for another follow-through type day to appear before looking for new buys. I have seen a lot of faulty basing structures too in many charts.

Tuesday, June 21, 2011

Saturday, June 18, 2011

Equity Put/Call Ratio Has Spiked

Click on Chart to Enlarge

The chart above shows the equity put/call ratio with a 3 day moving average in blue. It has spiked to the highest level since Nov 2008 and is right at that level now. Other times the ratio spiked like this it led to immediate reversals higher. However, those rallies eventually failed and moved to new lows. Since the indexes are near support from the March lows right now, it may be reasonable to expect a rally here to form what looks like a right shoulder on a head an shoulders formation. It would make sense to do that , and then break the neck line at least briefly even if it then continues higher.

There is a little divergence the last couple days on the NYSE McClellan Oscillator suggesting improving breadth. It is not the major kind seen before large moves up, but still suggests a rebound is probable.

Friday, June 17, 2011

JO Chart Explanation

Click on Chart to Enlarge

The chart above has some notes on it. It explains the logic on this trade. Learn this set-up, because it is a common one across many markets. I am looking at a set-up like this in the stock indexes right now too. Nasdaq broke first support today. Put/call ratios have been quite high, suggesting a rebound is likely. The same set-up is also in play in the broad commodity indexes CRB/CCI. With commodities looking weak, I expect any rally to fail here in stocks and move to at least moderate new corrective lows.

Thursday, June 16, 2011

New Trade - Short JO

Place an GTC sell stop order to enter short JO, a coffee etf, at 66.35. If filled place a GTC buy stop 71.57.

Commodities look close to breaking down hard out of a triangular consolidation. The next move down will probably be explosive. Hold onto the BAL/cotton short for now, and place this one on JO/coffee. I would also be keen on shorting USO or UHN with a well thought out strategy.

Tuesday, June 14, 2011

Market Update

Click on Chart to Enlarge

Here is a possible pattern scenario on the S&P 500. The recent move down since the beginning of June explosively retraced the prior small wave, which itself related well to the prior waves. But the move down became extended suggesting a larger pattern beginning. From a price logic standpoint this suggests that a new downward pattern is now unfolding, or possibly that an expanding downward pattern is ending, in which case the move up will likely be less explosive. The blue rectangles are the same time duration, so if any upward move from here retraces the recent move down slower than it happened, then the balance of power is still down.

The 1295-1300 is the first overhead resistance on the chart. Today was the 2nd day of a rally attempt in a market correction. IBD says that a 1.7% or greater advance on increasing volume from the prior day, should occur at day 4 or after to confirm a possible new advance. So keep an eye out for that here. After looking at many charts recently, I am leaning toward a continued correction. There are some base failures and high profile stocks that seem likely to decline. That should continue adding pressure on stocks.

Click on Chart to Enlarge

This is the CRB index. It seems very likely to me that the May low will be broken based off this upward consolidation after an explosive downward move from the highs. If it does break the May low, then based off historical tendencies, we are likely in a bear market which should have a long way to go yet.

Coffee looks like a good short opportunity and there is an etf, JO, that could be used. I may post a trade on that soon.

Thursday, June 2, 2011

New Trade - SSO

The market averages are bouncing today after finally completely filling the large gap up from April that I had mentioned previously. I still think the odds favor an advance off these levels.

I am going to post a new trade here on SSO. That is a 2x bullish S&P etf.

Buy SSO today with a market order. Current price is 52.29 which is the blog entry. Exit with RSI (3) overbought.