Click on Chart to Enlarge
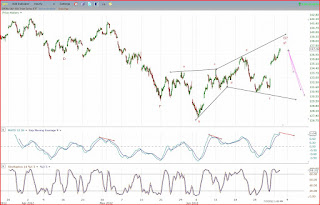
Hourly chart momentum oscillators are overbought with very mild signs of bearish divergence indicating that the short term trend is near a top, but likely has at least a day or so left before making a short term peak. Of note is that the gap down from 5-8-12 has now been filled. There are a couple small over head gap downs that are as of yet unfilled. I would use the large gap up from last Friday as an initial target estimate of downside potential once this hourly trend turns down.
Click on Chart to Enlarge
The daily chart of the indexes show overbought stochastics momentum at this point and are showing bearish divergence. Additionally, flag or wedge patterns may be forming but would need a break of the lower trend line to have some confirmation that they may play out with a downside follow through. Daily chart bearish divergence at a LOWER high than the prior overbought signal is often a great technical signal to short. So at this point, the market would need to quickly weaken and create a bearish stochastics cross to give a nice signal. A few more days of upside would negate the divergence.
Click on Chart to Enlarge
The weekly 14,3 stochastics is rising and at 50ish as of this week. The 50 level may be a resistance level for a continuing downtrend.
The chart above shows the 5,3 stochastics which is now overbought on a weekly time frame. This shorter term setting typically catches the major turns within a trend. So in this case, it is overbought at a LOWER high. If the downtrend is to continue, we do not typically need to see the 14,3 get overbought. The 5,3 setting should suffice for topping signals, so I am watching it here as of the next week or so.
So we have all three time frames overbought, and potentially in a downtrend. This could lead to a POWERFUL downward move if the market trend does continue down.
Keep in mind that looking at the chart of the NYSE it is far from its 2011 highs, and also several percent off of the 2012 highs. Many world stock indexes did not make new highs in 2012 above the 2011 highs. I take this to be a major non confirmation, and the broader NYSE and Russell 2000 indexes also did not make new highs in 2012 like the DOW, S&P and Nasdaq did. So despite the current optimism, I think this is more likely still part of a downtrend, that may be set to enter the most vertical downward phase of its move.
Price patterns indicate what may be one of the largest and fastest market declines one is ever likely to see could occur after the current rally completes. My suggestion is to continue to attempt short positions for a major payout phase.


No comments:
Post a Comment