Click on Chart to Enlarge
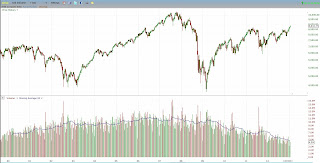
This chart shows the QQQ Nasdaq 100 etf with volume underneath the price chart. Notice that the average volume is at the lowest point in over a decade! Looking back throughout history, it is the norm for volume to expand in bull markets. However, at over 4 years from the low, we are still seeing declining volume in this case.
I don't think there is any long term bullish interpretation of that. I think the argument is how bearish that is. I continue to monitor this index for a head and shoulders top pattern which is nicely formed so far and has successively declining volume into this right shoulder which is textbook.
Again, my suggestion is to recognize the danger for longs here, and place protective stops and to keep an eye on technical set-ups for potentially short-selling at the high of what could be a right shoulder to this topping pattern.
Click on Chart to Enlarge
Also, this is the NYSE. Notice the similar pattern. Volume has declined sharply since the March 2009 low and is at the lowest average volume in over a decade. Again, this is not typical for bull markets and should be a long term red flag.
With the NYSE up over 100% in the last 3.5 years, it would be hard to imagine that there is still much institutional buying power on the sidelines that is yet to be deployed in this bull market. Add that to the fact that mutual fund cash levels are still hovering near multi-decade lows (courtesy of Sentimentrader.com), I don't think that there is much ability to lift stocks a lot further.
Click on Chart to Enlarge
The daily RSI on SPY closed above 70 today which is the typical overbought level. However, it will almost always form a bearish divergence when at new highs like this. So, we will probably see some further upside over the next couple weeks, but it may become more choppy.


No comments:
Post a Comment