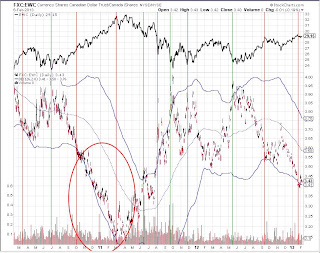
Click on Any Chart to Enlarge
Hopefully this will be followed up with a video, but the currencies have been not confirming the strength in stocks of Australia and Canada. Additionally, the US Dollar has not been weak as expected with the current US market strength. The charts above show that when the currency to stock ratio becomes extreme as indicated by the Bollinger band configuration above, inflection points are typically near.
So expect a correction in these markets. Additionally there is daily time frame technical divergence coupled with over zealous bullish sentiment (historically so by several measures). So the picture fits for a correction.


No comments:
Post a Comment