 |
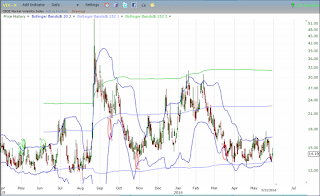
| VIX with Standard Deviation Bands |
The VIX has a skew in its data in that it will spike to the upside and not to the downside. So there is not an "even" distribution of VIX readings above and below the average.
In the past when the VIX has hovered around the light blue band, that is a longer term complacency signal. And while I don't have a way to quantify this currently, I would suggest that a spike to the upper light blue band would be likely on a legitimate correction in stocks. At this stage in my estimation stocks may hold up for a while, but without much major upside progress.
That being said, SPY is back up into horizontal resistance of past prices, and there are plenty of stark divergences present as prices are pushing towards new rally high coming off the winter lows.
The scans that I have ran recently have been consistently mildly bearish in the short to intermediate term on average. However, the reality is that in some past instances comparable to the current environment, stocks got hammered big soon after. Other times, stocks just meandered higher in low volatility type trade.
So, from a trading perspective, it would make more sense to me to do nothing, or take a small out of the money position in options to profit in the event of a big market sell off. I will try to quantify this a bit further and see if there is any rational profit expectation that I can find comparing to the past similar markets.
Pete
No comments:
Post a Comment