So the question now is really what the probable future course of action will be.
I have run some backtest scans comparing the current market position to the past trading history of SPY, and I would have to conclude that there is not a clear directional bias based on the past tests.
Obviously the sharp sell off yesterday has a short term bullish perspective when looked at on its own. But some of the other recent comparisons I've made have shown consistent muted upside for a couple months after the recent really low volatility type readings we've had in the last couple weeks.
Click on Chart to Enlarge
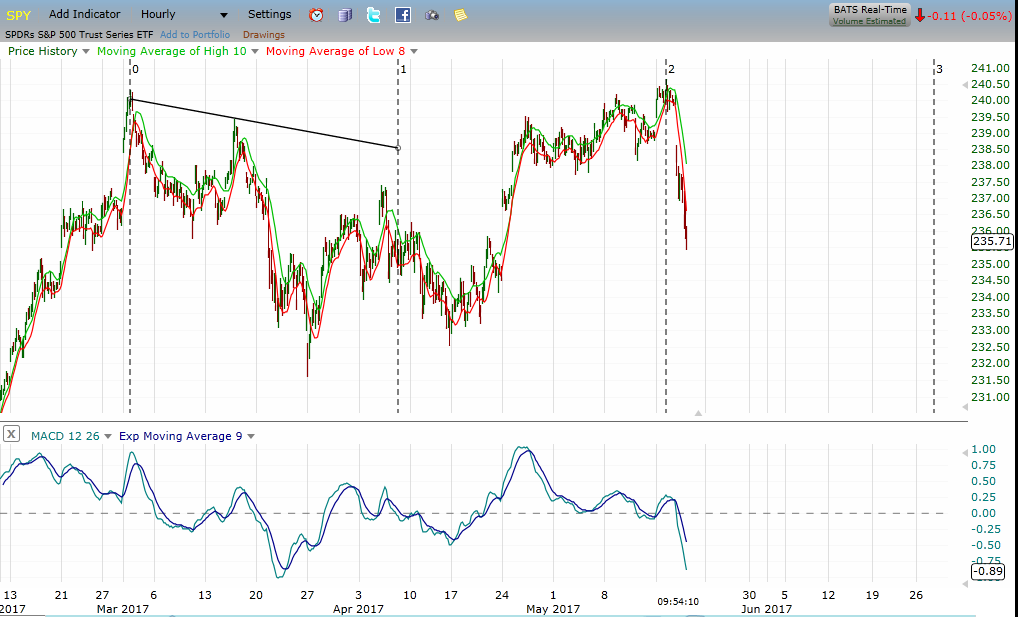
This is an hourly chart of SPY. And the pattern here, from my perspective would suggest that there is a downside bias through June, with a possible low forming in late June. And that would fit with a typical correction in stocks. Historically, a median correction in the SP500 is about 6 weeks and about 11%. This is for corrections that last greater than 1 month from high to low.
So given that we are in the seasonal "sell" time frame, and the time and structure of the pattern here near the recent high, couple with the technical analysis of weekly time frame divergence on the recent poke to new highs, I will proceed with an outlook that the downside risk still is greater than the upside potential for the next few weeks.
Looking at the MACD in the hourly chart above, we can see that it is "oversold" but with no bullish divergence yet. I would certainly expect that a divergence will form on this time frame before a nice rally could ensue. So, it appears that price still have at least some work to do here to the downside before a multi day low could form.
Pete
No comments:
Post a Comment