Tuesday, March 31, 2009

Wednesday Trade Prep and Bullish Set-Up

Click on Chart to Enlarge


The chart above is a 15 minute chart of QQQQ for the last 8 days or so. It is showing an island top pattern on this time frame and also a head and shoulders type top. If the market falls from here, the standard target for this would be around 28.00 on QQQQ which also happens to be near the 61.8% retracement of the rally off the March low. There are also unfilled gaps underneath current prices that are likely to draw price down to fill the gaps.

I made a put option trade on SPY at about 1:30 ET Tuesday. The short-term model was nearing overbought, but never quite made it, so I could not justify recommending a blog trade on this. The futures are off to a solidly negative start in the overnight session, and I would not suggest trying to buy into a large gap down tomorrow. Also, if there is a large gap down, that will skew the risk to reward ratio for trying to enter a bearish trade tomorrow. For blog trading purposes, I will wait for a more clear signal after a more extreme price movement.

From the looks of the price pattern I would think that SPY will move down toward the 74.00 level into next week which, if accompanied by short-term oversold signals, may offer a solid bullish trade entry for the blog. But, that may be the last solid bullish set-up before things really fall apart. And even if this scenario plays out, I am still not certain that I will recommend a bullish trade due to the negative larger trend. We'll see how things look when the time comes.


Pete

Bear Market Bottoms Revisited

Click on Chart to Enlarge


Due to the strong rally the last few weeks, I wanted to take a look again at what type of price action has historically confirmed the end of bear markets. I originally made this post in mid-January so that blog readers could get an objective and easy to calculate way to "know" when the bear market is over and when to get back in long term investments. For those interested or questioning whether this bear market is over, you should read that post because the same logic applies to both the ends of bull and bear markets.

To sum up that prior post.....a near fool-proof method of knowing that the bear market is over is to see a handful or more of bear market rallies where finally a rally off a new bear market low is about 120% the size of any previous rally.

The chart above shows the current bear market with the approximate % gain of every rally lasting at least a month before making new bear market lows. The current rally stands in the 26+% range. The Nov-Jan rally was about 27%. So we need to see about a 33% gain off a bear market low to be 120% of 27%. That would correspond with 888 roughly in the S&P 500 if the market continues higher during this current rally.

So, it is not safe by historical standards to assume the bear market is over yet. From a pattern perspective I would say with near certainty that it is NOT over yet and we will see new lows, probably in dramatic fashion, before it is over.


As an aside and follow up to yesterday's post......

Here is a link to the 2008 Blog Trade Review post I made in January for anyone interested.


Pete

Monday, March 30, 2009

One Year Blogiversary and First Quarter Trade Review

Click On Chart to Enlarge


I started this blog in early April of last year because it was apparent in January of 2008 that the 2002-2007 bull market was over and that this bear market could be a severe one. I wanted to give friends and family a chance to take control of their investments to some degree, seeing as the largest segment of our population is hitting retirement age. Could there be a worse time for such a bad bear market?

Despite the horrible buy and hold performance for stocks since the bear market began, the huge increase in volatility has provided the short-term trader with almost the best possible environment to make money. Also, the advent of inverse ETFs has made it easily accessible for the retail trader to profit during market declines.

On account of the one year blogiversary and the end of the first quarter, I wanted to give a trade review and discuss some simple money management ideas for how to fit the blog trades into an investment strategy. The first quarter trades provided excellent results with a current string of 6 winning trades to only one small loss.

The chart above shows only the 2009 blog trades. I posted the 2008 trade review in January. Most of the info is self explanatory, but I wanted to explain some things so that interpretation of the results is easy.

The "Stop?" column shows a star if the trade was exited with a stop loss as opposed to the typical indicator signal. I have explained before that I don't typically recommend stops for these trade because it theoretically hurts the performance of a mean-reverting system.

The "$10,000 Per Trade" column under "2009" show the running total of profits from trades so far this year if devoting exactly $10,000 to each recommendation.

The "$10,000 Cumulative" column under "2009" shows the running account value with the intial $10,000 included if the entire account value was devoted to each trade. This allows a compounding effect.

The next 2 columns are the exact same thing except that it includes all the 2008 short-term trades as well which are represented by the purple font beginning value in those columns.


What you can see is that starting with $10,000 on the first blog trade in April of last year, and using the cumulative strategy, the account value would have more than tripled, gaining over 200%. No commisions, etc. are taken into account, but that wouldn't change things much. The only change in real life implementation of that strategy is that the first BGZ trade this year overlapped the following SDS trade. That would decrease the return a little. Otherwise, the trades are all non-overlapping and could realistically be traded in the "cumulative" fashion.


If simply devoting $10,000 to each trade since the first blog trade in 2008 the profits would be over $17,000 as of today's closed trade.

Those two strategies are really what I had in mind for blog followers when I started the blog, and they are still the two ways I would recommend approaching blog trades from a money management perspective. That is either....

1) Decide on an initial amount to devote to these trades and treat it like its own account continually devoting all profits (or losses) to the next trade to create a powerful compounding effect.

2) Make a fixed $ investment in every trade.

I think strategy #1 makes sense for a beginning trader or a small account size to try to increase account value. I think strategy #2 is more realistic for a large account size and is a more "business-like" approach.


Hopefully this post was somewhat helpful and not just a boring read. It shows the power of a solid system with the inherent leverage of the ultra ETFs. I suppose you could take the idea further and propose using 3x ETFs for all trades or deep ITM options, but in the event of a very bad trade for whatever reason, that could result in an undesirably large drawdown in account value. I believe the 2x ETFs can be traded in the cumulative manner using this blog without much worries of any type of crippling drawdown.

Tomorrow I will again touch on the topic of what kind of price action is needed to confirm when the bear market is over. I know that many hope it is over already, but, in short, at this point I would advise extreme caution in that regard.


Pete

SDS Trade Exit

The short-term model is oversold after the declines Friday and this morning. So I am going to post the SDS trade exit price as the current price around noon ET. For anyone lunchtime only traders I would suggest exiting now. For anyone able to trade at the market close, I would suggest selling it a few minutes prior to the close today as today has the typical qualities of a close near the day's lows.

The entry price last Wednesday was 76.14 and the current price is 80.67 as I type for a 5.94% gain.

My guess is that the next blog trade will potentiall be a bullish trade if theS&P 500 falls back to around 740ish give or take. I don't have any interest in recommending the BGZ trade until we get back another overbought short-term reading.


Pete

Sunday, March 29, 2009

Sharp Decrease in Buy to Open Put Options Last Week

In recent weeks I have discussed how put/call ratio data has shown complacency in that the ratio of put to call volume had not become very extreme on the Feb-March decline, and the ratios have been VERY low on the recent advance. Today I wanted to talk about another way of looking at put and call purchases.

Sentimentrader.com has an indicator that looks at the amount of calls and puts that were purchased by small traders as opening transactions. Small traders typically provide good contrary signals at extremes. The importance of looking only at buying transactions to open a position is that you can be sure that the traders are bearish when they open a put position and bullish when opening a call position. So looking at the data this way filters out the "pure" directional bias of less sophisticated traders that historically are most bullish at market highs and vice versa.

What the data shows from this past week is that opening put purchases dropped sharply to levels only seen at previous intermediate tops in this bear market. The current level is on par with the May 2008 and Oct 2007 tops, though not as low as in January of the last 2 years. Call purchases have not risen to troubling levels at this point but the message is clear enough.

Taken together with recent put/call volume data and historically extreme breadth readings, it seems that we should be very close (couple days to a couple weeks) to a significant retracement of the recent market rally.

This week I will be looking for a good opportunity to recommend a purchase on BGZ again with a multi-week or multi-month holding time frame to try to make a large gain on what I expect to be another fierce decline in stocks in coming months. The last trades on BGZ were modestly profitable, but the rate of decline never picked up to the level which justified a longer term hold. It often takes several tries to catch a major trend shift, so it is important to remain alert as as any large price pattern looks to be completing.


Pete

Friday, March 27, 2009

Short-Term Expectations.....My Take On It

Click on Chart to Enlarge

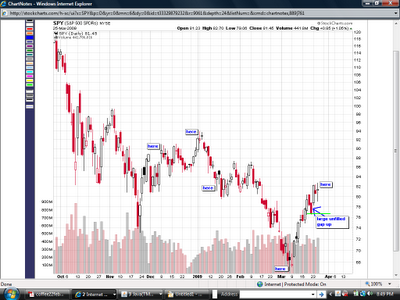
The chart above is SPY at about 3:00 ET. I have included some notes on the chart with what I think is most likely happening from a market logic and pattern interpretation.

After the low 3 weeks ago, there was an advance which included several small corrections of roughly equal size. Then there was a decline about twice as big last Thursday and Friday. I had expected there to be a larger correction after that, but the market has made new highs and is yet to form a really solid reversal pattern.

So my interpretation is that a wave did complete before that larger correction and now we are in another wave up which should end early to mid next week if this idea is correct. After that I do think there will be a much larger pullback than any since the March 6th low.

There are two relatively short-term models from Sentimentrader.com that I use to time entries and exits for blog trades. The most sensitive one did hit oversold later in the same day that the entry occurred for the current trade on SDS. The slightly different and longer short-term model has yet to even near oversold, but is building a bearish divergence with each new high in price. This slightly longer model is the one that I will use to post the trade exit because it is making more "sense" with price action. Recent trades have had very little drawdown intratrade, but I expect this one will not be the same way. It is easy to get spoiled after several bang, bang type trades in a row.

To sum up, I am pretty confident on several different grounds that we are close to the start of a very significant pullback, but it looks like it will be a week or so before an exit signal will come for this trade on SDS.

Wednesday, March 25, 2009

Spinning Top Candlestick in SPY

Click on Chart to Enlarge


Today's action was a bit wild and ended up forming a large "spinning top" candlestick pattern. This shows indecision and a violent struggle for direction. When this occurrs after a long trend, it often will lead to some amount of a reversal. It is not considered to be a high reliability pattern, but by looking back at charts of recent months, several of these candles have formed at important highs and lows.

I made a post the day of the March 6th low talking about the long-legged doji candlestick and almost every comment would be the same for today, except in reverse since we are well into a strong rally. The spinning top candlestick has a larger real body than the long-legged doji candlestick, but otherwise they are similar.

Also, according to Quantifiable Edges, there is about an 80+% tendency for 2% or larger gap ups like Monday's to have price close below that opening within 5 days. That would suggest about an 80% chance of another 4% decline in SPY by Monday. Of significance is that in the data table from that study, the only 2% gap ups that did not make that cut were either 1 or 2 days after a major intermediate term low. We are not in that situation, so I would say the probability is greater than 80% currently.

The short-term model is actually oversold already. But let's see what tomorrow brings and then see if there is follow-through to the downside or not. I may suggest setting a stop on the current SDS trade tomorrow, but I think the chances are good for a pullback.

Of note the 3x ETFs BGU and BGZ made high volume long-legged doji candlesticks today. In context of everything I've talked about the last week or so, I think we are very likely to get a pullback over the next few days.


Pete
Click on Chart to Enlarge

Only time for a quick post right now. The chart above is a SPY 30 minute chart. It shows 3 successive topping tails as price tried to move above the last two days highs. In my experience 3 consecutive candlesticks like this is a very powerful reversal pattern.

The SDS order from last night should have triggered this morning on the open. The short-term model was not overbought, but it could be considered a bearish divergence. That added to the set-up today makes me strongly suggest entering this ASAP for anyone not in it. I may suggest placing breakeven stop relatively quickly if this moves in our favor today. That would be because the short-term model is not overbought and could have some upside left on that basis. Exit will be standard exit at next oversold signal of short-term model.


Pete

Tuesday, March 24, 2009

Harami Candlestick and Bearish Divergence

Click on Chart to Enlarge

The chart above is SPY as of today's close. Price gapped down at the open today then managed to climb back to fill the gap in the early afternoon. However, it was met with immediate selling and price fell the rest of the day. This created what is called a "harami" candlestick. It is composed of a large candlestick (like yesterday) followed by a small candlestick (like today) whose real body (the fat part) is entirely inside the real body of the large candlestick.

This is not a pattern that I get too excited about, but it does often lead to a retracement of the current trend. Here are a few other points to look for when analyzing the quality of a harami pattern:

1)
The longer and stronger the trend in force, the more significant the pattern
2) Pattern occurring at or outside bollinger bands helps to assure that price is at a statistical extreme and may be ready for reversal
3) If the large real body day is the largest real body of the move, I believe the pattern is more reliable as it approximates a short-term climax top

In the chart above you can see that price touched the upper bollinger band yesterday. The upper band has been a stalling or major topping point for every rally of this bear market. We should be on the lookout to see if things go differently this time as that may indicate a change in character for the market. Also, the real body of yesterday's candle was very large and news related which makes me more willing to believe it was a short-term climax point. There is also a shorter term technical divergence on the hourly chart of MACD and RSI.

Click on Chart to Enlarge


This is a 55 minute chart of SPY. In the last post I showed that a bearish divergence was forming on the 90 minute chart MACD indicator as price made new highs yesterday. On this 55 minute time frame, there was a bearish crossover in the last price bar of the day.

The short-term model never made it to the overbought area today. However, this may actually indicate weakness because it has created a divergence between price (going higher) and the indicator (making lower peaks). On account of the factors I discussed already and the intraday double top, I entered a half-sized trade on SDS shortly before the close today. My price was 76.65 so that will become the new recommended limit price for this trade.


Modified Trade Recommendation....

Place (or modify) a "day only" limit order to buy SDS at 76.65 for tomorrow (Wednesday).


Pete

Monday, March 23, 2009

Bearish Trade Set-up for Tomorrow

Click on Chart to Enlarge

The chart above is QQQQ which is the Nasdaq 100 ETF. I had made a post a week or so ago suggesting that the unfilled gap down from Feb 17th may be a price target and potential resistance level for this rally. Today that gap was closed, and convincingly so. I feel that the odds of a nice bearish trade set-up are increased now and I will be willing to act on the next overbought signal from the short-term model. I believe that we will get that signal tomorrow morning due to the sustained strength today.

While I have not posted a chart for this, SPY is currently about 0.50 shy of filling the Feb 17th gap down at 82.74. So I would like to see price move up a bit tomorrow and then potentially enter a trade on SDS.

Click on Chart to Enlarge

This chart is a 90 minute chart of SPY about an hour before the close. I have shown a standard MACD below the chart because it looks like a bearish divergence is forming. There has not been a new bearish cross on the indicator yet, so it would be nice to see that occur tomorrow to help confirm a loss in momentum.

To simplify a potential trade entry on this.....
Place a "day only" limit order to buy SDS at 71.85 for tomorrow (Tuesday).

That order corresponds to the February lows in SDS (highs in SPY). In similar fashion to the limit order I suggested for the last trade on QLD, when looking at entering a trade with a limit order, I like to place them below a key support level in hopes that the market will "run the stops" and then immediately reverse giving a fantastic entry. That would require about a 2% gain tomorrow at some point to trigger the order. Depending on what things look like tomorrow I may change entry instructions for this trade.


Pete

Too Uncertain for a New Trade Right Now

In follow up to yesterday's post, I will not be making any new trade recommendations today. The futures are way up this morning (currently over 2%) due to anticipation (and maybe assimilation) of the Fed's new bank rescue plan.

It is entirely possible that selling will come in once the market opens in typical "sell the news" type fashion, so I certainly cannot suggest to buy at the open today. Also, buying well off Friday's lows will adversely affect the potential risk and reward for a bullish trade that could have been justified by Friday's oversold short-term model readings.

With that being said, if I had to pick a direction for the market this week it would be up, and I would not be surprised to see the rally hold up today. There is still an unfilled gap at about 82.75 on SPY. I am not counting on that gap being filled, but I think that the odds are as good or better that it will fill as that it won't.

Also, the extreme price action and optimism created by further gains would be theoretically typical for a large degree first leg up (wave "a") in a contracting horizontal triangle. It will suck many people into the market as the excitement grows each day, only to disappoint by failure to make any new highs once that leg is complete.

For day traders, I think there could be a good bullish trade set-up if the market does not move more than 1 to 1.5% below the opening price in the first hour of trading. Look for "soft" sideways/up and down action as opposed to vertical type retracement for this set-up to be good.

The two potential set-ups mentioned in yesterday's post are still what I see as the next trading opportunities for the blog. I would prefer to see more upside this week, but either set-up should make for a good trade.


Pete

Sunday, March 22, 2009

Equity Put/Call Ratios Spelling Trouble

Click on Chart to Enlarge

The chart above is the S&P 500. This chart is updated from a chart I showed about a month ago showing what pattern I believe has been forming over the last several months. There is really only one significant change. At that time I thought it was likely that a triple three correction was completing, however the market never made the kind of dramatic decline to confirm the start of a new/larger degree bearish pattern. As each passing day goes by, the picture becomes more clear for the future due to an ever decreasing amount of patterns that can form from this point. I had mentioned previously that the most common pattern to form at the end of a complex correction is a contracting triangle. That is the pattern I have projected on the chart for future expectations.

The purple box on the chart that I labeled "target zone" was the box I drew about 2 weeks ago in anticipation of a dramatic advance for the first leg up in a horizontal triangle. You can see that so far it has been a precise projection. From this point, I am not sure if the first leg up is complete or if there will be another push higher this week. Short-term models are oversold after a two day decline on lighter volume. That is usually a set-up I would take for a bullish trade, but I have some hesitation here because price will likely go much lower if the first leg up is complete. I will see how Monday morning goes before deciding on whether or not to make a trade here.

If the market is able to move to new highs, I will definitely be looking to recommend a bearish trade at the first good opportunity (I would like to see the 825 level exceeded). If the market continues to fall, I will look to make a bullish trade after about 50% of the recent advance is retraced. So stay posted tomorrow, as I may end up suggesting making a bullish trade, but with only half the dollar amount usually devoted to a trade. Then if the market continues to fall and we get another good set-up, we can add another equal size trade at a lower price.


Click on Chart to Enlarge


The next chart is one I have shown before which is the ratio of the 5 day average (1 week) of the equity put/call ratio to the 63 day (1 quarter) average. This tends to be a good intermediate term contrary indicator. What we are seeing is that the 5 day average has recently dropped to about 80% of the 63 day average. This is an extreme reading and shows excessive optimism in the options market. These types of readings can occur without the market slowing down when the market rises out of a bear market low. But if that is not the case (and I don't think it is) then price will usually have trouble making much more headway. While I have not shown the chart here, the 10 day to 126 day ratio is also currently at about 80% or 20% below "normal."

On a side note, if the market were somehow able to exceed 875 in the next few weeks, I would have to consider a change in longer term bearish perspective. That would not really affect blog trading recommendations, but as of now there stands to be a GREAT put option trade setting up if the approximate scenario above plays out.


Pete

Thursday, March 19, 2009

Brief Update - QLD Exit

The limit order of 25.34 for QLD was hit yesterday morning creating another very good gain for this trade. From a few reader comments, it looks some people got out around 24ish which was still a nice gain and was more strictly an indicator based trade. So congratulations on those trades. Other than a couple attempts at a longer term BGZ trade a couple months ago, I have never suggested managing a trade on the blog like this last one. I usually stick very much to the indicator/models. The price pattern on this trade just suggested high probability of sustained upside, so I wanted readers to take advantage of that if possible.

Anyway, short-term models are nearing overbought, but I am not going to suggest rushing into a bearish trade just yet. I think there is probably a little more upside left but would look to get bearish around 825-830 on the S&P 500. It will be at least tomorrow before I can really devote any time to watching the market and posting any new trade recc's. For now, I would focus on SDS or DDM and figure out a price level corresponding roughly with 83.00 on SPY as a potential trigger price/limit order to consider a bearish trade.

I will give a more detailed big picture post and get back to regular posting this weekend. I will be traveling the next couple days off and on.


Pete

Saturday, March 14, 2009

I Will be Out of Town Next Week

A family emergency has come up and I will be leaving town today and am not likely to be back until late next week. So I will not be posting and probably will not even be watching the market in any fashion the next several days.

Because there is currently an open blog trade on QLD right now, here are my suggestions for anyone depending on these posts for follow up:

Place a stop loss order at 20.00 instead of the limit order I had suggested. Then if the market rises above the 25.34 level just sell it with a market order.

OR

Just place a market order to exit Monday morning, which is a fine decision based off the short-term model since it is currently overbought.

Since I don't have time to give a bigger picture post that I was planning on giving, here is a basic summary of what my thoughts are on what might happen......

I think the market is still in a developing "triple three" correction that should complete over the next several weeks and lead to another MAJOR decline in stocks. The most common type of pattern at the end of any complex correction is a contracting pattern (i.e. horizontal triangle or rising wedge). In those cases, the first leg up is usually the most powerful, with the next legs up losing momentum. If a horizontal triangle is forming right now, there will probably be more upside next week, but that may be the highest point the market reaches for several months. So be careful about any rash decsions to get back into the market on a long term basis even if things look great next week. If the market rises strongly into next week, that should provide a good bearish ETF trade entry. I would consider 82.50 on SPY to be a price level to get bearish at if that is reached by this coming Friday. I don't know if I'll be back by then or not.


Pete

Friday, March 13, 2009

Click on Chart to Enlarge

This chart is a 15 min chart of SPY showing the 3 significant pullbacks so far since this uptrend started. They have all been in the $2.00 range. The pullback this morning was on low volume and looks kind of rounded on shorter term chart (5 min), so it looks like a "healthy" accumulation type base in a still active uptrend.

The last hour is very important in that during strong uptrends, you typically want to see the "smart money" buying at the end of the day. It is about 3:00 ET right now, so I don't know how the last hour will go, but I am not seeing anything that suggests weakness yet, so I am not going to recommend an exit yet for blog purposes for the QLD trade.

The short-term model is actually still holding in the overbought area, which is typically a sign of strength. In other words, if the trend was over, things would turn down very soon after hitting extreme levels. Maybe it will in the last hour, but I would not count on it. Another thing I look for during very stong moves is any new high in price that creates an indicator divergence with the short-term model. That has not happened yet, so again I think that is suggestive of some more room to move up into next week.

Pete

Change QLD Limit Order

Short-term technical indicators and the short-term model are very overbought after yesterday's strong follow-through to this week's earlier strength. While it is possible that prices on QLD could move up to the upper end of the range I suggested in yesterday's post, I don't want anyone trying to get the top tick and not get out of a good trade. On that note.......

Change the QLD GTC limit order to 25.34 instead of 26.00.

Hopefully, there will be some follow-through today to fill that order before the weekend arrives. Also, after I see how the morning goes, I may post again later today if that order is not filled and I think it would be best to get out before the close.

Pete

Thursday, March 12, 2009

Potential Price Targets on QQQQ/QLD

Click on Chart to Enlarge

The chart above is QQQQ which is the Nasdaq 100 ETF. Now that it is obvious that the recent downtrend is undergoing a correction I wanted to show what I am looking at as far as price targets and potential resistance for this market rally.

I have drawn a few horizontal red lines and one horizontal green line on the chart. I could have drawn several others of the same type, but these are just going to be examples. The red lines mark the prior day's close when there is a significant gap down at the open. The green line is the same thing except that the market gaps up the next day instead of down. I have mentioned several times in past posts that I meticulously track these gaps because they have such a strong tendency for price to come back and fill the gap, and they also often act as support or resistance. This is all the more true for QQQQ as it seems to fill gaps even more often than SPY, etc.

If there is a visible space between the adjacent price bars, that is called a "window" in candlestick terminology. The idea is that when a window is created, the analyst should look for it to be "closed" by price returning to the range of the prior price bar/candlestick at some point in the future. Additionally, once the window is closed, prices often will resume the larger trend shortly thereafter. By looking at the highlighted examples on the chart, you can see this has been the case in QQQQ for several months.

There reason I am bringing this topic up is that there is a large open window at 30.50ish on QQQQ that was created by the large gap down on Feb 17th. That would be the upper limit I would look at for the first leg up of this market rally. I would strongly consider making a bearish ETF trade at that point if the indicators look good/overbought. That price level corresponds to 27.50ish on QLD which is the fund for the current blog trade.

The minimum price level I would expect to be attained probably by next week would be 29.18 on QQQQ and 25.35 on QLD. Those prices correspond to the next swing high above current current price levels. Also, those prices would correspond with the 80.00 level on SPY.

So I am not suggesting any changes currently for the blog trade, but am laying out a kind of "if-then" scenario for the next potential trade. If prices move up to the open window area and the short-term model is overbought, then I would have confidence to enter a bearish trade. Over the weekend I will make a post relating to the probable/possible patterns that could develop on this rally and relate that to some past posts I have made on the topic. While I do not base trades on this blog purely off of any price pattern, patterns largely factor into my "filtering" process for trade recommendations on the blog as far as which signals to act on.

Wednesday, March 11, 2009

Short-Term Overbought, but Still Good Chance for Further Gains

The short-term models I use for the blog trades are clearly overbought this morning though they have not turned down toward neutral yet so there is no rush to exit on that account. Yesterday was a hugely positive breadth day, and those types of days coming off a major low tend to lead to further short-term gains. I saw a historical study this morning suggesting consistently positive returns even out to 5 days after a "blast off" day like yesterday. That would be in line with my personal expectations of this price pattern.

So bottom line for trading purposes, I won't argue with anyone exiting right now because typically I would be suggesting an exit right now. In this case, I just think the probabilities are very good to get a further push up from these levels.

Maintain GTC limit orders of 26.00 to sell QLD on further market strength.


Pete

Tuesday, March 10, 2009

Quick QLD Trade Update

So far today we have exactly the kind of confirmation from a candlestick perspective that should lead to some further market strength. We began the day with a large gap up, which I had mentioned last night was a good thing in this case. Also, the market has easily mananged to power through the first hour highs which bodes well for the rest of the day.

From this point there are two potential ideas I have for exiting this trade. The first is simply to exit when the short-term model becomes overbought as it may by tomorrow. The second is to recognize that some further market strength is likely over the next week or so, and set some limit orders to try to get out as prices meet key resistance. I think strategy #2 will make the most money in this case, but there is added risk in holding a little longer. Since this is my blog and most people will prefer to make more money than less, I will give directions on strategy #2 unless/until I see some evidence that the target area I have outlined in recent posts will not be attained. Since, as of right now at least, the QLD entry I suggested got us in only a few cents off the recent lows, we have some cushion to try for a little "extra" profit and still be unlikely for the trade to go negative.

So for now I recommend placing GTC limit orders to sell QLD at 26.00.


Pete

Monday, March 9, 2009

Waiting for Confirmation from Doji Candles

Click on Chart to Enlarge

I usually show charts of the S&P 500 or SPY, but the chart of DIA today looks interesting because of the two obvious doji candles the last two sessions. The picture is similar in other indexes, but I thought this chart was the best.

What we need to see now is a large up day preferably beginning with a sizeable gap up to help confirm the rejection of this price level in the near term. Any rally that begins here is likely to be sharp and sizeable I believe.
We'll see what tomorrow brings.


Pete

Sunday, March 8, 2009

Doji Candlestick in Major Indexes Friday

Click on Chart to Enlarge

The chart above is the cash S&P 500, ticker $SPX. On Friday the major stock indexes gapped up slightly and then put in a strong first hour advance adding about 2%. After that, prices fell about 4% going about 2% lower than Thursday's close. Then in the last hour of the day, prices advanced about 2.5% to close the day almost unchanged from Thursday or from the open Friday.

The end result of this price action is called a "doji" candlestick pattern, and more specifically a "long-legged doji." A doji candlestick is one where the open and close are almost the same, so that the fat part of the candlestick just looks like a little crossways hash mark. When a doji occurs after a long downtrend (or uptrend), it shows that the market is in temporary perfect balance. I think of it as a ball in freefall. Then as the ball hits the ground, there is an instantaneous moment where the ball is perfectly motionless before being propelled upward by a strong reactionary force from the ground.

The doji is a fairly reliable candlestick reversal pattern in and of itself. However, if the following day is a strong day in the opposite direction of the prevailing trend, then the pattern is even more reliable. So Monday will give us a lot more information in this regard. There are other more subtle/detailed factors to look for that will give you additional information on the strength of the pattern. Here are some of the factors to look for:
  1. the higher the volume, the more reliable the pattern typically
  2. oversold technical indicators will help to assure market is at an extreme
  3. pattern occurring outside bollinger bands should be more reliable since price is at a statistical extreme
  4. pattern occurring inside the bollinger bands when prices have recently been outside the bands may be even stronger as it is a sign the current trend is weakening
  5. when looking at a potential bullish reversal pattern, it is best if price closes in the center of the range (high to low) or higher
  6. extreme sentiment readings help assure a market is primed for a reversal from a psychological perspective

In sum, Friday's action is suggestive of a strong reversal within the next couple days in my opinion. A large up day on Monday will give added confirmation of that outlook.


Friday, March 6, 2009

QLD Trade Entry and Market Update

Click on Chart to Enlarge

The limit order of 19.72 for QLD was triggered today for the next blog trade. The short-term model became very oversold early this week and I had said that I was not interested in getting into a bullish trade at that point. However, I felt that if the market made new lows that would set up a better trade.

The short-term model is now basically showing a bullish divergence as the markets have moved lower from earlier this week, but the model has not even quite made it back to oversold. That is potentially good or bad for our trade...bad because the model is not at an extreme oversold condition meaning some more downside may be reasonable....but good because the strongest signals from this model tend to come on divergence between price and the indicator like the present one.

The chart above is the Nasdaq which as you can now see has made new lows below the November lows. The chart for QLD looks very similar and the limit order I suggested corresponded to the November lows. Now that the Dow, S&P, and Nasdaq are all beneath the November lows, I think the probabilities are increased for a strong multi-day advance.


Click on Chart to Enlarge

This chart is a 60 min chart of SPY and is currently showing a nice bullish technical divergence on the MACD and RSI indicators. However, there has really been no confirmation to the upside yet. I still feel it is most likely that the S&P will fall down toward the 660 area before the next rally attempt. Whatever downside is left, my guess is that it will happen quickly.


Hopefully any drawdown is not too uncomfortable on this trade. This trade is a "bottom picking" type trade which goes against the larger trend. The trade has very explosive potential, but also a higher than normal chance of significant intra-trade drawdown than the trades I normally recommend. So now we just await the next overbought extreme on the short-term model for our trade exit.


Pete

Thursday, March 5, 2009

New All Time High in AAII Bearish %

Click on Chart to Enlarge

The chart above is a screenshot from Sentimentrader.com showing the last few years of data of the bearish respondant percentage from the weekly American Association of Individual Investors survey. Notice the huge spike below the green lines on the most recent reading. The scale is inverse so the large drop on the cahrt is actually a large increase in bearish outlook. The current reading is the highest ever in the history of the survey. The next highest reading was in 1990 and occurred just a few days after the bottom of a major leg down in 1990 where the market lost about 20% in 3 months. Taken together with all the other studies showing extreme pessimism, I have to feel more confident that a tradable bottom will occur in the next few days.

This morning we are getting another huge downer which has taken us down (as I type this) to the 127.2% retracement % of the Nov-Jan rally that I have noted in previous posts as the top of what I see as the major reversal zone for this bottom. From the looks of the charts, it seems that a move down to the lower end of the 660-690 zone (or a little further) may occur pretty quickly from this point.


Pete

Wednesday, March 4, 2009

Waiting for a Better Opportunity

Click on Chart to Enlarge


Yesterday the S&P 500 reached as low as 692ish which is about 5 points above the 127.2% retracement of the Nov-Jan rally. Today we saw an advance and a swing low formation where the lows of Monday and today are higher than Tuesday's, forming a potential inflection point.

Today's advance was looking nice, but faltered into the close taking some "power" away from the candlestick formation that formed. It is nice to see the "smart money" end-of-day buyers pile on into the close (which didn't happen) when looking at a potential major turning point. It is also nice to see the close higher than the mid-point of the candlestick 2 days ago. We almost got that, but not quite due to the sell-off into the close.

The chart above is a chart of the March S&P futures. The reason I am showing this is that the reversal on the futures chart looks more legitimate though still far from perfect. Also in the overnight session last night (Tuesday night) the futures went as low as 681 which is a good bit lower than the cash S&P 500 went (692 and change). So maybe that overnight low flushed things out and this reversal will stick, but I would not be surprised to see things roll over one more time before bottoming.

As of the close today, the short-term models were nearly overbought, but not quite. However I am not interested in making a bearish trade if they do become overbought tomorrow. If the markets do go to new lows, then that should give a good bullish trading opportunity for the blog. If they don't, and this reversal sticks, then probably the next trade would be a week or more away assuming the markets make a sharp advance during that time frame and give us a good bearish trade opportunity.

As far as current trading opportunities go, maintain the limit order to buy QLD at 19.72 in case the market rolls over again to new lows. If that order is not hit the next couple days, we'll just cancel those orders and wait for the next clear opportunity.


Pete

Tuesday, March 3, 2009

Look for 660-690 as Major a Reversal Area on S&P 500

Click on Chart to Enlarge

The chart above is SPY. The light blue, green, and pink lines are the 127.2% and 141.4% retracements of the March-May, October, and Nov-Jan bear market rallies. Without going into a lot of detail and history here, these two levels seem to be the most common reversal levels for the next intermediate low once a new bear market low is made. There are three main scenarios that occur:

  1. double bottom where the prices are almost the same
  2. a temporary bottom at the 127.2 to 141.4% retracement of the most recent rally
  3. a leg down much larger than the previous rally and really should be compared to the other legs down rather than the previous rally (even these legs down often run into short-term support at the 127.2-141.4% levels, example Sept of 2008)

Since the current leg down did not make a successful double bottom, I think the probabilities are good that this leg down will end around the 690-660 levels on the S&P 500 which correspond to the 127.2 and 141.4% retracements of the Nov-Jan bear market rally.

Because that is still, say, 2-6% below current levels as of today's close, I think maintaining the current buy limit order for QLD at 19.72 is a good strategy for the next couple days.

There are virtually no indicators suggesting a bearish bias at this point, even for the intermediate term (next few weeks), so it only makes sense to go for a bullish trade right now. Also I had mentioned that the put/call ratios were terribly low last week for the position the market was in. Sentimentrader.com did some further analysis of the data and found that part of the reason for the low ratios was a HUGE amount of call options being traded on news-heavy financials like Citigroup, etc. I guess there are a lot of long shot trades being made in case some news comes out and sends the stock up 100% or so. So, disregarding those options, the ratios probably aren't too horribly low. In any case, there is enough other evidence to justify turning bullish right now for the intermediate term. I would guess we will see a tradable low by Friday.

Pete

Monday, March 2, 2009

SDS Trade Exit and QLD Limit Order

This morning the sell limit order of 106.00 was hit for SDS resulting in a 12.6% gain on this blog trade. In actuality, it would have been impossible for anyone to get in at as bad a price (94.15) as the price I posted so anyone who traded it probably got in closer to 92.00 or 93.00 which is even better. Also, 106.00 was the approximate level SDS was trading at today when the short-term model first hit oversold, which means we got out at a reasonable price.

For now, I want to focus on getting into a bullish trade at a good price without too much drawdown. The Nasdaq has clearly held up better since last November than the Dow or the S&P and I don't see any good reason at this point to expect that will change on any move up from these levels, so the fund I will suggest is QLD, which is the Nasdaq ultra/2x ETF. From looking at several different factors, I think there is likely to be a few more percent down before a major reversal so I am going to suggest using a limit order to try to enter QLD on further weakness even though the short-term model is already oversold and justifies an entry.


So here is the next trading recommendation.....

Place GTC limit orders to buy QLD at 19.72 unless/until further notice is given.


Pete

Sunday, March 1, 2009

Limit Order for SDS Trade

Just a quick post tonight.....

The stock index futures are down so far this evening. I would not be surprised to see 1 or 2 down days early this week then a reversal day.


For the current SDS blog trade, place a "day only" limit order to sell SDS at 106.00. If the markets were to fall by 3-4% or so that would put SDS in the 106.00 area and would probably also be short-term over sold or very close to it. So placing a limit order which gets filled may leave a little profit on the table so to speak, but it may simplify the exit in what is likely to be a volatile next few days.

If/when the short-term model gets oversold this week, I will recommend a bullish trade in anticipation of a significant/explosive short-term rebound. Despite modest VIX readings and low put/call ratios, the number of different indicators suggesting a bullish bias for the next few weeks is piling up.


Pete