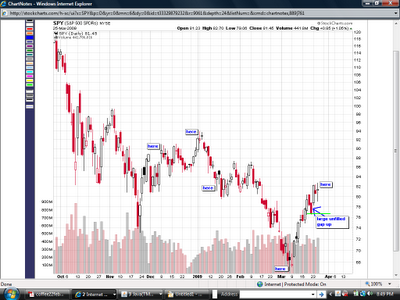
Today's action was a bit wild and ended up forming a large "spinning top" candlestick pattern. This shows indecision and a violent struggle for direction. When this occurrs after a long trend, it often will lead to some amount of a reversal. It is not considered to be a high reliability pattern, but by looking back at charts of recent months, several of these candles have formed at important highs and lows.
I made a post the day of the March 6th low talking about the long-legged doji candlestick and almost every comment would be the same for today, except in reverse since we are well into a strong rally. The spinning top candlestick has a larger real body than the long-legged doji candlestick, but otherwise they are similar.
Also, according to Quantifiable Edges, there is about an 80+% tendency for 2% or larger gap ups like Monday's to have price close below that opening within 5 days. That would suggest about an 80% chance of another 4% decline in SPY by Monday. Of significance is that in the data table from that study, the only 2% gap ups that did not make that cut were either 1 or 2 days after a major intermediate term low. We are not in that situation, so I would say the probability is greater than 80% currently.
The short-term model is actually oversold already. But let's see what tomorrow brings and then see if there is follow-through to the downside or not. I may suggest setting a stop on the current SDS trade tomorrow, but I think the chances are good for a pullback.
Of note the 3x ETFs BGU and BGZ made high volume long-legged doji candlesticks today. In context of everything I've talked about the last week or so, I think we are very likely to get a pullback over the next few days.
Pete

No comments:
Post a Comment