Friday, January 8, 2010
EUO Trade Set-Up (Bull Flag in the USD Index)
The chart above is the US Dollar index. It looks to be forming what is called a "flag" pattern. There is a strong advance off the lows which is the "flagpole" and then there is a downward sloping little parallelogram which is the flag. If price breaks above the upper trendline of the flag, I will almost certainly be posting a trade on EUO which is a 2x US dollar bull fund. As an idea of a price target for this pattern you project the flagpole up from the bottom of the flag. So that would be a nice move. In this case I think using a trailing type of stop would be best and keep an eye for divergence on RSI and MACD for exiting if price advances further.
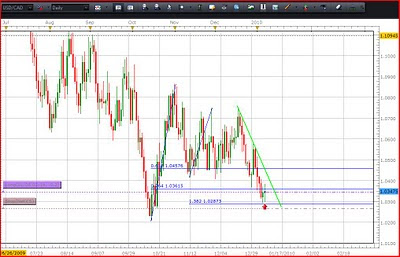
The chart above is the USD/CAD (US/Canadian currency pair). As of right now it is forming a type of Gartley pattern off of what could be a very significant low. While there is not much history on the chart, the explosive advance from Oct-Nov and subsequent slower retracement have broken the pattern of fast downward moves and slow upward moves for many months. So this is a good chart to take away that simple logic from. Of course maybe price won't move up from here, but I think it will.
For entering such a reversal pattern, you can look for candlestick patterns that indicate a bottom with a stop just below the reversal candlestick, or you can just enter and place a stop below the low of the entire pattern (lowest point on chart). Also, as a more conservative approach would be to wait for a break of the downtrend line (green line) and then enter with a stop below the most recent swing low or other nearby support.
As a side note the USD/CHF (US/Swiss Franc) pair is also looking to form a nice flag pattern, so there are several avenues to take advantage of potential further USD gains. UUP and EUO are dollar index ETFs; FXC, and FXF are the Canadian and Swiss Franc ETFs, respectively.
Subscribe to:
Post Comments (Atom)


No comments:
Post a Comment