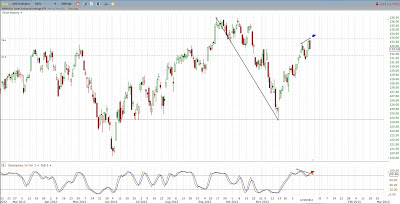
Stochastics Bearish Divergence on the Stock Indexes Daily Time Frame
Click on Chart to Enlarge
The chart above is DIA which is the Dow 30 ETF. It formed a bearish engulfing pattern today which is a bearish top reversal candlestick. The reversal took place at a 78.6% fibonacci retracement of the move down since September, and there is a classic bearish divergence on the stochastics study under the chart.
Based on the multiple time frame momentum set-up and the price pattern, I am expecting a high to occur soon. So this could possibly be a very significant high. The ideal time frame for a high is not until next week from my perspective, but that could be a little anal retentive.
If the stochastics or MACD turns into a sell signal soon, it could be a very profitable signal from my perspective.
I will update in detail in an upcoming post.

No comments:
Post a Comment