Click on Chart to Enlarge
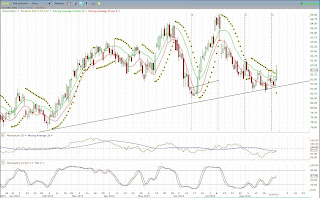
The last 2 days have seen mild price gains on successively declining volume. This is not the typical bottoming reversal pattern in a correction. For short term traders I view this as a new shorting set-up
On the option front the OEX put/call ratio remains high which is typical more bearish for the market than bullish. These index traders have a "smart money" pattern of option trading which is to increase put activity as the market rises.
On the other hand, both the equity and total put/call volume ratios remain low and have had very muted rises on this 3.5 week correction so far. For more confidence that a corrective bottom is near, I would want to see this ratio higher as measured by strategies I have shown many times before on the blog and in my free course.
Price action is the final say of analysis and so for a corrective bottom to occur and have some indication of a new uptrend we would need to see a higher high than the recent swing high on 8-26-13. But understand from the recent videos I've made that the weekly currents on the technicals are only just turning down. MACD is still above 0 and just confirmed a divergence pattern sell signal. Stochastics has another 2-3 weeks still before possibly being oversold. The parabolic SAR has not even triggered a weekly sell at this point. So while on a short term basis the currents are modestly oversold and could sustain a multi day rebound, the larger currents are down and I think will likely continue to pressure stocks for at least a couple more weeks.
Click on Chart to Enlarge
I have not updated much on the US Dollar since it broke out of a triangle chart pattern in February. And since that time frame it has had a markedly different correlation with the stock indexes than the consistent negative correlation for the last 4-5 years. The chart above shows the ratio of US Dollar/S&P 500 which lets us at least monitor the statistical relationship between them and we can see from the green lines that when the dollar has spiked outside the bollinger bands have been when the significant corrections have taken place. And notice that the ratio currently would need to see more dollar strength and stock weakness to bring the ratio outside the bands.
Click on Chart to Enlarge
This chart is the US Dollar index itself. Of note is that the recent correction took more than twice as long as the prior advance and has not retraced all the advance. Also notice the divergence pattern in stochastics at the recent bottom. These facts couple together suggest to me that the price logic is still favoring a bullish trend in the US Dollar. Today triggered a daily SAR buy signal and so we may see some follow through to this rally attempt in the dollar. What is less clear from the correlation at this point is what impact that will have on stocks.


No comments:
Post a Comment