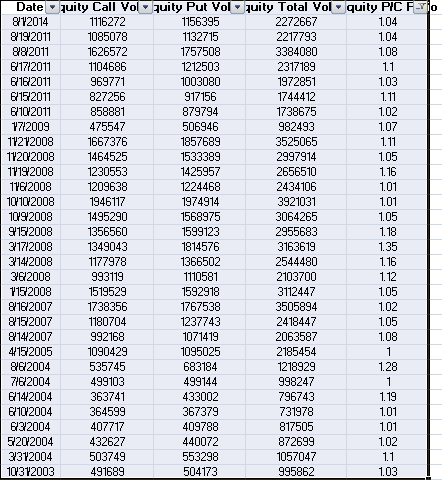
Well here we are now and it appears that so far things are playing out very much as suggested/expected. Today will market the 8th day of the current rally off the 8-7-14 low. And it definitely has been a swift and directional advance. So now that we are in the time frame of where we may expect things to slow down or for a possible larger scale top to complete, let's look at some more details.....
This list shows all equity put/call readings greater than or equal to 1.0 since CBOE data available in 2003. I had suggested that the Aug 2007 and June 2011 instances were the most technically similar in recent years with overbought and divergence conditions on the weekly time frame already being in place.
If we replicated the rally from June 2011 low to the July 2011 high, it would put SPY at about 204.00 this week to next week. But again it may be more sensible to correct for volatility and to understand the tendency for final highs or secondary rallies to double top or fail to exceed an old top. From a simple chart based standpoint as opposed to measuring in percent terms, the rally off Aug 2007 lows made a slightly higher high for the bull market, basically double topping then declining. Off the June 2011 low, the rally was more brief and failed slightly below the prior high from May 2011.
So as we now see the QQQ at a new high, and the other indexes still lagging with concurrent divergences still present, I believe it is sensible to expect this move to stall near or slightly above the recent all time highs in SPY.
If prices decline below the recent low from Aug 7th, I think that would be a sign of broad market weakness. So that could be a line in the sand to watch depending on your holdings and time frame.

No comments:
Post a Comment