Sunday, November 23, 2014

The Down Trend Is Ending In the Yen - Signs of Exhaustion in the Commitment of Traders Data

Click on Chart to Enlarge

Click on Chart to Enlarge

The chart on top is the FXY etf which is the Japanese Yen.  The lower chart is the CoT data, but it covers a longer time period than the top chart, so checks the dates for correspondence.

I am pointing it out here because it is displaying one of the most significant and sure signs of exhaustion there is based upon the Commitment of Trader's data.  So this trend appears to be ending, and one could look to initiate speculative longs soon with outstanding reward to risk ratios.

Of note is the horizontal support line.  The low at the beginning of 2014 marks the point of maximum net short by  speculators.  This can be seen in the chart of the CoT data below.  That point is a multi year extreme in net short by large specs.  Even on the move to lower lows in FXY, the specs didn't get more short, so this shows that their selling capacity is exhausted - it is a type of divergence or non-confirmation with the price trend.

Now the other interesting thing here is that when price broke that horizontal support, it led to the smart money/commercials, actually having to sell into lower prices for a few weeks, which is opposite their style.  This is a hallmark of the end of a trend when the commercials have to capitulate and take a massive loss.

I will link here to a post I made about cotton in 2011, because it accurately showed this pattern in reverse - as a topping pattern - on this blog as the top occurred in cotton before a massive bear market took place in the following year or so.

So one could look here to short the USD/Yen pair on appropriate signals.  Also one could look to buy FXY call options with several months to expiration with strikes in the 80-85 range after careful analysis.  Also, YCL is a 2x leveraged bullish Yen fund, which would be used as a leveraged equity play to go long on appropriate signals.

I personally am looking at some call options on FXY, but currently have no position.


Tuesday, November 18, 2014

Gold, Silver, Steel Long Opportunities

I made a video over the weekend covering in detail the technical situation in gold and gold stocks, silver, steel stocks, and gave some ideas on individual companies to look at for trading purposes.  However, the jack on the audio is not connecting and the video has no sound so I will give a brief recap here.

It appear likely that gold and silver have made bear market bottoms and the recent explosive upward days in those markets shows what I believe is the beginnings of a swift short covering rally which will lead to directional gains over the coming weeks in gold, silver, and related miners.

Specific stocks that I like the looks of at this time are MT, SID, NG, FSLR, SPWR, MGM, HHS for longs.

ETFs I like right now are GDX, SIL, UNG, SLX, DBA for longs

In order to find potential trades at this time I would recommend using screens with the following parameters:

1) Screen the gold, silver, and steel industries for stocks with price/book ratios less than 1.0
2) Screen the same industries and sort them by dividend yield.  The highest dividend yields may be some of the bigger companies which are undervalued and are potential multi year holds.  Screen these companies for tradable patterns or technical set-ups
3) Screen the above mentioned industries for short interest ratio.  The higher the short interest ratio, the more likely there will be forced buying added to the expected underlying rally in the metals and shares.  The higher short interest can lead to fantastic short squeezes but also generally coincides with increased volatility, so from a risk/reward basis it may not mean much.  But from an investment standpoint, if you created a basket of the highest short interest stocks in these industries right now, I think it will out perform the underlying metals or miner ETFs.

Let me know if you need any other further info or analysis here and I will try to do it in timely fashion as with a swift short-covering rally, each day that passes may significantly shift the near term reward/risk in a less favorable direction.

Pete

Friday, November 14, 2014

A Few Charts of Interest in Commodity Related Stocks

As the commodity board appears to be bottoming for the intermediate term, there are several ways to screen for trade candidates.  At this time I would suggest screening stocks in the gold, silver, oil, and steel industries for short interest amongst other technical factors.  The heaviest shorted stocks can really strongly rally after a low occurs and the markets rally into the short squeeze price region.

Some charts of interest are NG, MT, SID, OIS.

There are plenty of solid looking technical opportunities out there right now that could be traded according to an objective technical method.  The key will be in risk management.  How much capital is appropriate to put in play at once as a bottom attempt occurs?  That is a great question.  One idea is to begin with a hourly chart and place a trade.  Then if the trade is successful, and the trend continues, you can take another trade on a daily time frame signal when it develops.  And again, on appropriate patterns, you could also add another position if the weekly time frame signal occurs as the trend continues.  It could be done with a simple technical indicator like MACD, or other more complex strategies.  For a purely technical trade I like to use a moving average channel breakout after a technical divergence to be my entry signal.  Then I use the moving average channel itself to trail stops as the trend develops.

Pete

Wednesday, November 12, 2014

CRB Commodity Price Analysis and DBA Price Logic Trade Example

Click on Chart to Enlarge

This chart is the CRB commodity index with a weekly time frame showing the RSI.  Notice that the weekly RSI is oversold for the last few weeks.  Also notice the last time in early 2012 that a weekly oversold reading occurred, commodities rallied in extreme fashion in the coming few months.


Click on Chart to Enlarge

The is the CRB on a daily time frame.  Notice the RSI not moving above the 50 level during this decline.  However there is a building divergence in the RSI, which, if followed by a move in the RSI above 50, would be a likely sign of a breakout to the upside in my opinion.

Additionally, there are many commodities with either record net long commercial/smart money positions, and some with bullish divergence in the commercial/smart money net positions.  Coupled with the current oversold condition and daily time frame divergences across the board, I am suggesting to prepare for a major commodity board advance in coming months.

I have recently taken a position in DBA based upon a price logic set-up and a non-confirmation of DBA with the broad commodities.  So DBA recently made a higher bottom last week as the CRB was making a lower low.  This hints at strength in this index (DBA).

Click on Chart to Enlarge

This is the hourly DBA chart.   I entered at 25.52 with the original stop at 25.22.  The stop has now been moved up to 25.30.  If the price rally happens to retace above the Oct high in less time than the recent decline took to form, then I will hold the position and trail the stop on a daily time frame.  If price rally more slowly I will exit at any hourly divergence that forms at a lower high below the Oct high.  And obviously as I trail the stop up, it is possible that the position gets stopped out in the interim.

So we will see how this develops, but the general dual time frame set-up here with weekly over sold, daily bullish divergence, and a non confirmation from DBA all suggest a quality opportunity.  So I have just entered on the hourly chart for a position that could be a daily or weekly time frame hold.  Assuming prices rally, a simple scale out can be used, but I like to incorporate the price logic analysis into the trade follow through so that if a strong new trend occurs, I don't exit part of the trade on the smaller time frame.  That is why I plan to hold and use the daily chart trailing stop method if price rally quickly above the Oct high.

Pete

Thursday, November 6, 2014

Gold and Stock Market Update

As of today, 11-6-14 both gold and silver have triple time frame MACD bullish divergences on the weekly, daily, and hourly charts.  So I am keeping a close eye on them for bullish reversals in the price action.  Any daily reversal candlestick pattern could be used as entry.  Or an hourly chart breakout/momentum signal could be used as well.  In these types of cases, assuming a buy signal is given, the stop is placed below the low, and then a portion of the trade is exited by using the hourly chart to give stop movement and/or exit signals.  Then a portion is held using the daily chart for signals.  I have given ideas on how to trail stops using MACD or moving average channels in the past.

Also for the US stocks, the hourly chart bearish divergence is pretty mature right now, so we are probably very close to a short term pullback in stocks.  However, given the strength of the rally and no divergence on the daily chart, it seems unlikely to me that a top of major significance could be made until at least a couple more weeks pass and some daily time frame momentum begins to show divergence.

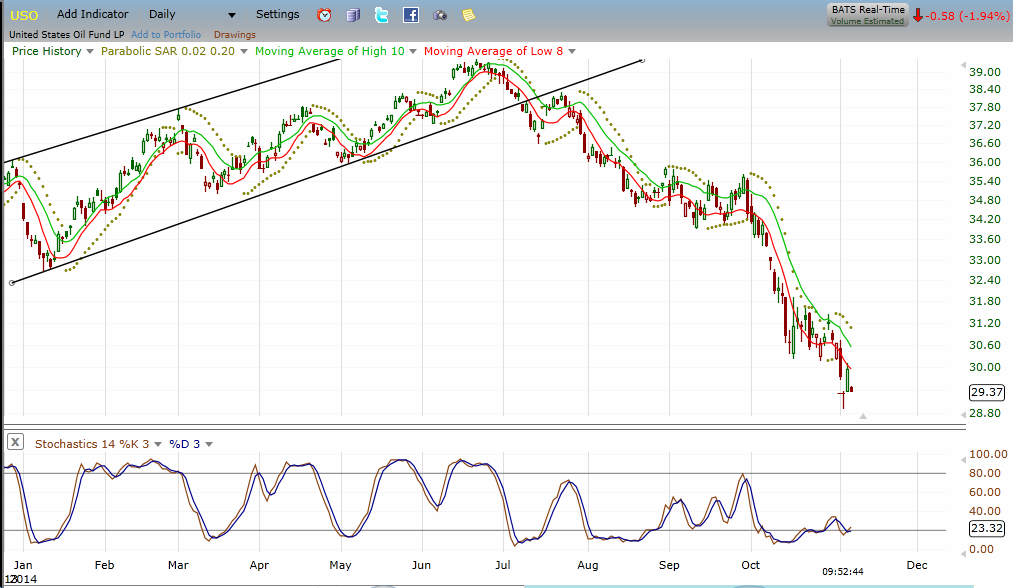
Also USO/oil prices are showing a very nice daily/weekly dual time frame stochastics set-up today for a long trade.  Weekly stochastics is oversold.  And the daily is oversold with bullish divergence and made a bullish reversal yesterday.  A move above yesterday's high in USO would be a buy signal with a stop below the lowest point of this decline.  A currently have an order in UCO to go long on a move above yesterday's high.

Click Chart to Enlarge

This is USO daily chart showing the stochastics below which has bullish divergence.  Multiple commodity markets have the underlying technical and smart money sentiment to stage major rallies.