Showing posts with label gold. Show all posts

Monday, August 27, 2018

Gold Short Covering Rally Looks to Me Like It Will Continue

Click on Chart to Enlarge

The chart here is of GLD etf and shows projections of a continued advance up from the recent lows.

Since the lows over the last week or so, the rally in gold has been notably larger than any counter trend advance going back to the April highs.  So by this measure, the rally has overbalanced previous moves in the leg down, and indicates by objective measures that a larger phase of upward market movement may occur.

I have drawn lines on 3 of the major short covering moves off of lows over the last 2 years, and then projected them up from this August's low.  And we see what looks like an 10%+ move as realistic coming off of the current low if it holds.

The sentiment at this year's lows was at a historically extreme level and would argue for the possibility of a major low occurring here.

The Commitment of Traders data showed that large speculators went net short at the recent bottom, which is very rare in gold historically.  It does not mean that the low is in, but would indicate the possibility of a historically large amount of speculative short interest to unwind which could fuel major legs up in months to come.

Other precious metals look to me to be in similar set-up, and so this complex I view as having explosive potential.  Just based on the moves over the last couple years, there may still be 3:1 reward to risk using a stop below this month's low, if the rally were to continue and reach gains similar to the amounts of previous rallies in recent years.


Pete

Wednesday, July 26, 2017

Breakout of Falling Wedge on GDX (Gold Miners ETF) - Probable Continued Price Advance in Coming Weeks

Click on Chart to Enlarge

In my last post I gave some perspective that gold and gold stocks would likely move higher in the near term.  And prices have done just that for the last couple weeks.

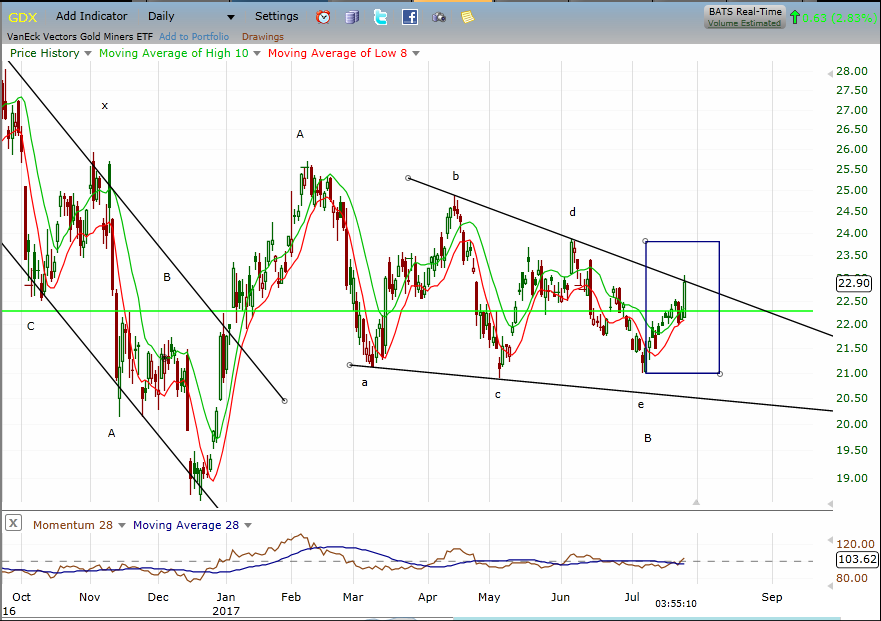
Currently on the GDX etf (shown above), price has moved up and touched the falling boundary line of a falling wedge chart pattern, which I have labeled here as an a-b-c-d-e triangle type pattern.

I'm sure some Elliott wavers would view this progression as an a-b-c-i-ii pattern with the current move up being the early stages of a wave iii, which would be anticipated to be strongly uptrending for a few weeks.

I have put a blue box on the chart to help gauge continued development of post pattern price strength and "price logic".  The idea here is that after a pattern or phase of market action completes, the objective signal of that a new phase has begun is that the last price segment is totally retraced in less time than it took to occur.

In this case the blue box represents the price and time consumption of the d-e move as I have it labeled.  So if that did indeed complete a contracting triangle/falling wedge, then the logical implication is that the current move up will rise above the top of the box BEFORE the right side of the box is reached (in this case that is August 10th).

Now I can't know that it will or won't do that.  But since the price is at a resistance line on the chart and beyond the midpoint of the box, it seems likely that a breakout will occur from the wedge very soon if my perspective is accurate.

It is not uncommon for price to back test a broken wedge line after the breakout occurs.  In this case say price moves up out of the boundary lines of the wedge this week.  Price may come back down to the approximate price level at which the boundary line was exceeded before moving notably higher.


Pete

Thursday, July 20, 2017

Gold and Silver Prices Finding a Bottom? Based on CoT Positions I Think So - July 2017

Click on Chart to Enlarge

The chart here is a chart of gold prices and the Commitment of Traders data for the last couple years.  This is produced on Barchart.com

What is notable here is that the red line, which is the "smart money" commerical traders, is showing the highest reading going back until the bottom of the bear market in late 2015.  Basically with prices where they currently are, these producers are not seeing the necessity of hedging much.

Also, it is rare for the red line to ever cross above 0 as it did at the bottom of the last bear market.  Basically the commercials are totally unhedged and are in a small speculative long position when that occurs.

The other side of the commercial position is the large speculators.  And you can see they have the lowest net long position since the bottom of the bear market.

I am making note of this here, because it seems very possible that these levels are significant enough to form a corrective bottom in gold and lead to a significant advance.

If prices are able to break below this month's low, I would expect that commercials would continue to support prices and the chop may continue.

Wednesday, July 12, 2017

Gold Stocks Possibly Completing Major Basing Pattern 7-12-17

Click on Chart to Enlarge

The chart above is GDX which is the major gold miners ETF.  I will provide here a brief summary of some key factors for analysis but without taking time for further charts.

1.  Commercial traders are the most net long (actually least net short) at any time since near the lows of the gold bear market and at prior lows of legs down in the bear market.  This suggest the potential of a bottom here in prices in a continuing bull market in gold.

2.  The June/July time frame is the annual/seasonal low point for gold historically, and then some of the strongest seasonal move historically is the late summer.  So from this standpoint, it makes sense to look for a low here.

3.  Since early 2016, the CRB/SP500 ratio has been at the lowest point on the chart since 1995.  The prior major trough was in early 1999, after which a major commodity bull market ensued.  So the valuation of commodities to stocks is historically low, and on a longer term basis, could argue for a commodity bull market to be in the works.

4.  I have placed a pattern labeling scheme on the chart of GDX above, which in this labeling scheme, would be the maximum complexity pattern for a correction which can occur in Elliott Wave terms.  Another interpretation that is still bullish would allow for some further decline but without breaking the December low.  On this note, a contracting triangle in wave theory would be common at the end of a complex move as the selling loses steam and a base is formed for a new move.

5.  The bullish engulfing pattern on Monday occurred right at horizontal support and this is a classis bottom reversal candlestick.  This does not suggest the length of any rally, but is further confirmation that a bottom of some degree cold well have occurred on Monday.


I entered long on Tuesday on NUGT which is the 3x gold miners ETF.

The stop is below Monday's low, and I plan a stop movement technique using a moving average channel if prices rise.

Out of individual gold stocks, I really like the pattern on ABX best.


Pete

Sunday, July 26, 2015

Time to Cover All Gold Shorts - Massive Rally Likely to Occur Based on Extreme Smart Money Position

Click on Chart to Enlarge

There are multiple factors currently suggesting that anybody short in gold get out as fast as you can.  The move down is almost certainly done or very very nearly done.  How big the rally will be, we shall see, but it could easily be 10-20% in the next 1-2 months.

The chart above shows the extreme oversold MFI14 indicator below prices of GLD.  And note the wide range bullish engulfing pattern on Friday as well.  That is a bottom reversal pattern.  It occurred on heavy volume and an obviously extreme move in price over the last few weeks.  Without knowing anything else about a market, understanding the implications of this candlestick should be cause to exit any short position.

Furthermore, there has been a huge increase in the commercial/producers/smart money positions on the long side of gold.  There was an extreme accumulation of new longs by commercials last week, and going back to 2006 (which is where my data currently ends) the commercial net long position is the highest it has ever been.  On a relative basis it corresponds with the peak net longs which have occurred right at the bottom of other declining phases of this bear market in gold. 

On the flip side the large speculators are the most net short going back the same amount of time.  The total speculative long position of small and large combined is also at the lowest point going back over the stated time frame.  The last time their longs approached the current levels was at the beginning of July 2013 right as a leg down was ending and a pretty swift and large bear market rally occurred.

Lastly, June and July is the seasonally most common time for a bottom to occur in precious metals.  So given the extreme sentiment, technical analysis and historical extreme move into gold by the smart money, this appears to be an exit point for gold shorts without question.

There are various long strategies that could be used here to capitalize on the anticipated rally.  One would be to buy the gold miners ETF on Monday with a stop below Friday's low.  Bullish option spreads or other directional option strategies may be appropriate as well.

Wednesday, January 7, 2015

Gold Inverse Head and Shoulder Awaiting Breakout

Click on Chart to Enlarge

Based upon the current action in gold and gold stocks it appears likely that gold will continue to form a major rally.  The daily chart pattern has the appearance of an inverse head and shoulders that has yet to break the neck line.  From a time cycle and chart structure standpoint, it appears to me that the breakout is close at hand.

I do have a bias here in that I have call options on silver as previously stated on the blog here.  My expectation is that metals will continue higher for the rest of this month.  I feel that there was and is still a quality chance for an excess of 100% return on call options prior to expiration.  But for some added time for things to unfold, I think a March or April call option would be sensible as well.

A break in the metals above the December highs could be a technical chart point of recognition resulting in either a failed breakout, or in my expectation, a continuation of the uptrend.

Pete

Thursday, November 6, 2014

Gold and Stock Market Update

As of today, 11-6-14 both gold and silver have triple time frame MACD bullish divergences on the weekly, daily, and hourly charts.  So I am keeping a close eye on them for bullish reversals in the price action.  Any daily reversal candlestick pattern could be used as entry.  Or an hourly chart breakout/momentum signal could be used as well.  In these types of cases, assuming a buy signal is given, the stop is placed below the low, and then a portion of the trade is exited by using the hourly chart to give stop movement and/or exit signals.  Then a portion is held using the daily chart for signals.  I have given ideas on how to trail stops using MACD or moving average channels in the past.

Also for the US stocks, the hourly chart bearish divergence is pretty mature right now, so we are probably very close to a short term pullback in stocks.  However, given the strength of the rally and no divergence on the daily chart, it seems unlikely to me that a top of major significance could be made until at least a couple more weeks pass and some daily time frame momentum begins to show divergence.

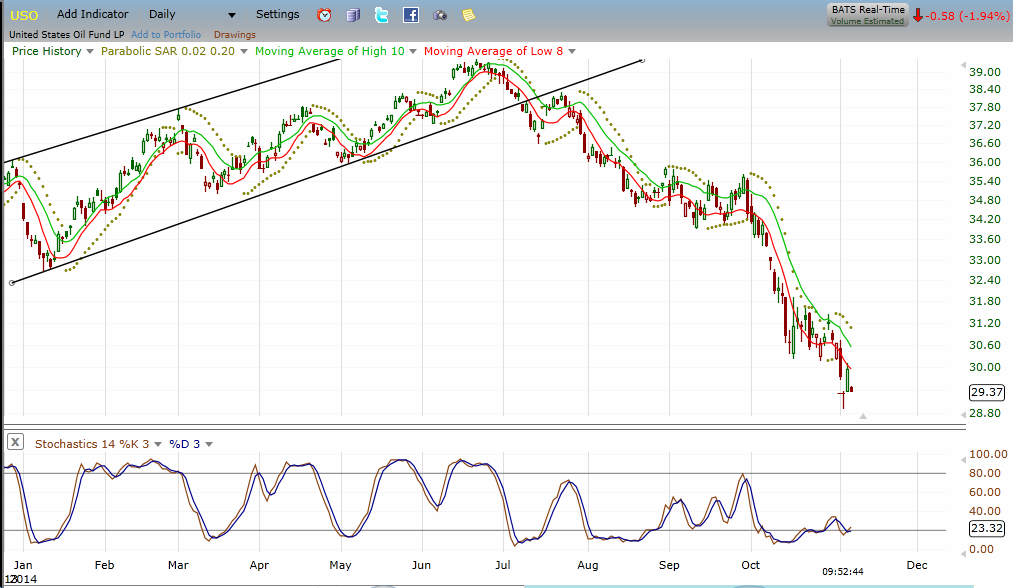
Also USO/oil prices are showing a very nice daily/weekly dual time frame stochastics set-up today for a long trade.  Weekly stochastics is oversold.  And the daily is oversold with bullish divergence and made a bullish reversal yesterday.  A move above yesterday's high in USO would be a buy signal with a stop below the lowest point of this decline.  A currently have an order in UCO to go long on a move above yesterday's high.

Click Chart to Enlarge

This is USO daily chart showing the stochastics below which has bullish divergence.  Multiple commodity markets have the underlying technical and smart money sentiment to stage major rallies.

Saturday, June 14, 2014

Gold Still Appears to Be On the Brink of Advance and is Showing Buy Signals

Click on Chart to Enlarge

As I have been tracking in recent months, gold prices still are unfolding basically as expected according to the outlined price pattern with somewhat of an inverted head and shoulders appearance.

We now have seen a reversal back above the horizontal line at the $1250 level which I mentioned was key support.  Technically, the daily MACD is in a buy signal now.  And using a momentum and moving average channel technique on the daily chart, it is also in a buy signal.  So this might well have been the low for this correction.  Additionally in comparison to common correction in gold historically, we are in the expected late stages of the price and time expectation for a correction.

Again, fall call options, GDX, GLD, or individual gold miners could all be ways to capitalize on the expected move.

I would highlight GDX, SIL, GOLD, GFI, HMY as possible stocks  and ETFs to analyze technically for buying opportunities based on price pattern and valuation.

Sunday, June 1, 2014

Gold Price Near Possible Price Pattern Low

gold completing a price pattern
Click on Chart to Enlarge

Following up on several recent posts I have made tracking a potential buying opportunity on gold, this chart shows that gold prices are currently at the $1250 level which I consider to be the ideal ending price level for this bottoming pattern.

As the chart notes above suggest, a quick move below that level followed by a move back up and any daily time frame technical buy signal, would be cause for long entry in my opinion.

While not shown on this chart, gold prices have also closed outside the lower daily bollinger bands for 4 straight days.  I have discussed this type of action before in other markets, but it can lead a near immediate rebound.  Additionally, weekly stochastics is now oversold at a high low, and price logic since the beginning of the year, suggests that the upwards move is the more powerful, and so we are sensible to prepare for the possibility of a higher low forming here.

Also please review some charts of gold seasonality and understand that for whatever reason, the June-July time frame is often when gold places a relative low.  And we are now entering that window.

Google results on seasonal charts here.


Wednesday, May 14, 2014

Keep Alert For Precious Metals Turning Up - Silver/Gold Ratio

 Click on Chart to Enlarge

This chart shows the silver/gold ratio and shows that it has been hitting multi year lows and is near its half year bollinger band.  When bull markets take effect typically the silver outperforms and we would expect to see this ratio rise.  Also, just from a statistical standpoint, when these strongly correlated metals show a ratio far from the mean, it may be a time to consider a pairs trade - in this case long silver, short gold as a conservative speculation.

However, in context it appears that this is further confirming evidence that the precious metals as a whole may be forming a bottom and be ready to turn up very soon.  Historically June is the seasonal low time frame for gold, and with all factors taken into context, from my perspective, we could be seeing the seasonal low here now.
Click on Chart to Enlarge

This chart shows July silver futures and shows a move below the winter lows and now a reversal higher.  This type of stop running happens frequently before major advances.  Even going back a year, the July contract just slightly broke below the June 2013 low, but the cash silver and SLV etf have not.  These types of non-confirmation between futures and cash or near and distant futures contracts also can be flags that trends are about to shift.

Whatever, your trading methodology is, my suggestion is to keep GDX and SIL on your near term watchlist for longs and also look at other individual stocks in those sectors, or even just stick with GLD and SLV etf for speculative trades.

Tuesday, April 22, 2014

Be Aware of a Potential Bottom in Gold and Silver

gold chart neutral Triangle completing
Click on Chart to Enlarge

Gold and silver prices appear to be completing relatively large scale patterns that I think will resolve to the upside.  I would anticipate gold to bottom somewhere between today and the second week of May and with not much more downside (either today being a low or next support at $1250 on the gold chart.

I would estimate that the next leg up would carry gold to the $1500 range if this scenario plays out.  Timing entry off of a 4 hour chart may provide a nice reward to risk opportunity.

Another way to possibly profit from this potential move would also be to purchase long call options with 4-5 months until expiration.  This may allow for a significant move with a reasonable risk to reward and limited capital outlay.

Monday, July 22, 2013

Gold and Silver Rally to Continue? Projections If So

Click on Chart to Enlarge

This is a chart of silver prices going back a few years.  I had recently mentioned in video updates that the smart money commercial traders were buying heavily into this market compared to historical buying/selling patterns.  They have not turned net long yet, but these producer dominated markets rarely get even close to net long.  So the current near net long exposure we are seeing is very extreme in its own right.

Based on seasonal patterns, the common time for gold and silver to form a bottom is the June/July time frame which coincident with the recent swing low in prices.  The leg down since last fall has been tremendous in both % decline and time duration compared to historical precedents.  This favors at least a relief rally in the metals if not a bear market bottom.

The chart above shows some historical comparison projections of the expected price and time of this rally if it is to continue to unfold into a typical bear market rally or even a first leg up in a new bull market.  In either case, we can expect some significant more buying to come in to even reach a minimum expectation.  So this would favor being on the lookout for short term buying patterns or signals to continue to follow this rebound up for several weeks.

Click on Chart to Enlarge

This is a weekly chart of gold showing an extremely oversold MACD.  Obviously with such an oversold environment a multi-month rally should probably be expected.  However, notice that there is no divergence pattern indicating the typical bottoming signal at this time.  At most major market bottoms, we see price make a lower low after a rebound from extreme oversold conditions.  But the technical indicator (MACD, RSI, momentum, etc.) will not make a lower low.  That is our usual tip-off that a bottoming set-up is present.

So given the overall context here, I would be looking for higher prices over the coming weeks, but with the tentative expectation that the rally may lead to another shorting opportunity and move to at least slight lower lows before a possible completed bear market.

Monday, April 15, 2013

Stock Market Update - Gold and Silver Bear Market

4-15-13 Stock Market Update

This video is accidentally split into 2 parts.  It covers stocks, bonds, gold, silver, oil, and the US dollar index.

Monday, October 1, 2012

Multi Market Update

9-29-12 Market Update

The video covers stocks, bonds, gold, oil, CoT data, AAPL.  Tighten stop or exit long equity holdings.

Thursday, August 9, 2012

Stocks and Gold Video Update

Click on Chart to Enlarge

Major price highs likely near in stocks and gold.  Bearish divergences are all over the place, and volume is at multi year lows.  AAPL likely set to break down from a failed base pattern.

Monday, July 23, 2012

Stock and Gold Update

7-23-12 Market Update

Price action so far off the recent swing high is suggestive that the rally since June 4th may be complete.  Flag patterns in the indexes are nearly confirmed projecting declines back to the Nov stock lows.  Earnings seasonal hits full swing this week.  Apple is hovering right at uptrend support and below the breakout point of a base it has already failed to breakout of at first attempt.  A negative earnings reaction on AAPL could trigger substantial follow up selling in stocks.

Gold is awaiting a breakout of a symmetrical triangle in the short term and a large descending triangle in the long term.  Likely breakout coming to the downside in my view.

Wednesday, July 18, 2012

Market Update - Stocks, Gold, Bonds

Market Update 7-17-12

Check out the video for chart patterns and indicators that are informative for the directions of stocks, gold, and US bonds.

Saturday, July 14, 2012

Gold Update - Likely Major Top Nearly Confirmed Complete

Click on Chart to Enlarge

Gold prices have been contracting into a symmetrical triangle over the last 1.5 months.  These can be continuation or reversal patterns.  Waiting for a breakout of the contracting trendlines will provide the best confirmation of the next price move.  If it breaks to the downside, the red line shows the minimum projection down based on the widest leg of the triangle which is the standard measurement.  The green line shows the same for an upside breakout.

If prices break to the downside, based on the chart support I think we will likely see downside follow through as I have projected in the past.

Click on Chart to Enlarge

This chart is gold daily prices with a parabolic SAR study which are the dots.  Also the bollinger bands are overlaid and are channeling sideways in a relatively low volatility squeeze.  This is coupled with the ADX study below the price chart.  The ADX shows readings below 20 continuously for the last month.  I have talked about these set-ups several times before.  But the low ADX for a long period can be thought of as a low volatility basing period before a major directional price move.  Which ever way the Parabolic SAR triggers could lead to a sharp price move as shown with green arrows in a couple prior instances.

Currently the Parabolic SAR has triggered a sell signal.  So unless it triggers a new buy, expect a downside breakout of this pattern.  But strength next week that triggers a buy on the SAR, would be indication of a likely rally for gold.  Seasonally gold tends to make lows in the early summer and rally into the late summer or fall.  So that would argue the bullish case, but the market would need to show strength soon to give some weight to that view.

Click on Chart to Enlarge

To put gold into longer term context this chart should be very helpful.  First the current top formation has taken the form of a large descending triangle.  The standard chart interpretation and measurement would suggest a likely downside breakout through the support at 1530.  And the measurement would suggest a move down to 1200ish as a minimum move.

The pink boxes show the 2008 bear market in gold and place that same box off the 2011 highs.  Here is what is significant.  The move from the 2011 highs has taken more time than the 2008 bear market.  So if prices break to new lows for the move, it would make this move more time consuming than that bear market.  This would imply a likely larger scale correction than any in the last decade long bull trend in
gold.  So I can't understate the importance of the 1520-1530 support line holding for the bullish gold case.  If it fails, it looks like a major bear market in gold will be confirmed.

Wednesday, May 30, 2012

Gold Breakdown Close at Hand?

Click on Chart to Enlarge

This chart is continuous gold prices.  I had recently highlighted the weekly potential bullish reversal off the lower bollinger band, but noted that I believe it is unlikely to lead to a legitimate leg up.  The action since then has further supported that view.

Looking at the chart, notice that the bollinger bands are expanding as price is testing a repeatedly touching the lower weekly band.  A close below the lower band with the bands expanding would again imply a sharp downward move to come, with the minimum target being to around 1300.  That would also be the first major support level below current levels.  That was the beginning of the last leg up of the bull market.  We may expect a break down to that level rapidly and then a rebound attempt possibly.

Any close below 1523 in gold would be a bearish breech of support and likely lead to a continuation move down rather than a return to the range.

The Euro is already oversold and has met the minimum downside target I projected in April.  However, major support is broken there as well, and a break down in gold would imply a continued spike up in the US Dollar and plunge in the Euro.

Also, as noted stocks have potentially completed a small counter trend correction and could be forming a bearish flag pattern implying a strong move down in coming weeks.

There is no convincing evidence in my mind at this point that this rebound is likely to continue much further.  The only major evidence is the elevated put/call ratio, but the rebound so far has been weak given past precedents.  I continue to view the intermediate trend as down in stocks.


Monday, January 16, 2012

Gold Update - Topping Before Next Leg Down

Click on Chart to Enlarge

Gold appears to be in the process of topping on a counter trend rally at this point.  The daily stochastic is overbought.  And price has slightly exceeded a swing high from the downtrend which can be a stop running point and possibly lead to a breakout failure at that swing high.

Unless the high at point "B" is exceeded by the next blue vertical line in mid March, the trend remains down.  A break of the December low would be a likely continuation point and possibly lead to a large gap down and continuation move to the downside.  What would that move look like?  Use the Sept 2011 decline off the high as an approximation.  "A" waves are typically dramatic - sharp price moves but short lived.  The next move down will probably be like that.

The CoT data is locked in a bear market pattern with no sign of any type of bottom being made here.  Silver is in a very similar position to gold.  The same comments apply.

The pattern looks like completed "flat" pattern down from the highs, with the current move likely being an intervening "x" move, before another larger downside pattern unfolds.

As a side note, the CoT data is suggestive that oil has likely made a counter trend rally high.  Entry for short oil trades could be made ASAP or wait for a break of the December low as confirmation.  The target would be for a move below the Oct low at a minimum. 

As an additional side note, part of my bias in expecting a failed breakout in stocks here is that the real money CoT data in the commodity markets at large suggests a continuing deflationary theme.