Showing posts with label 52 week high. Show all posts

Monday, December 4, 2017

Short-Term Weakness Ahead Suggested by Total Put/Call Ratio 12-4-17

To follow up on my recent post regarding SPY and the forward outlook here, I have 2 back tests of current conditions that I think are worth mentioned.

For the short term, today gapped up and price is opening outside the upper bollinger band and at a new 52 week high.  I ran a back test of similar conditions and looked at various sized gaps. 

The result is that there is about a 4 or 5 to 1 greater MAX loss than MAX gain during the session/today, based upon the back tests.  The average intraday decline FROM THE OPEN, has been about 1.0%.  And the close has been below the open more often than not, with a open to close loss of ~0.5% in the back tests.

So for the short term, this was/is a sell at the open and cover at the close situation, with a 60-80% chance of a gap fill during the session based on the back tests.

Click on Table to Enlarge

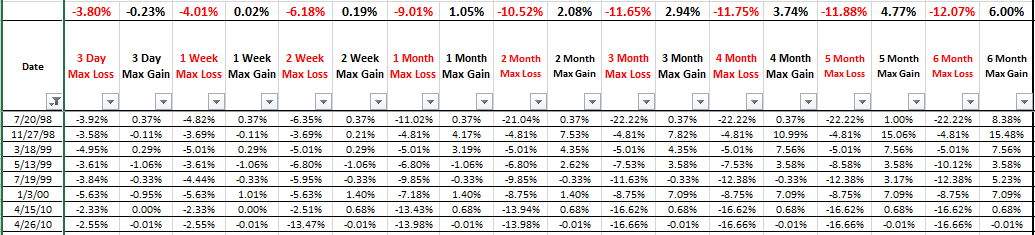
What this shows is a scan of times when the 5 day total put/call average was less than -1 standard deviation below the 20 day average of the total put/call ratio AND prices were at a 52 week high.  I also removed clusters so that we were looking at unique instances.

And what we can see is that there was a very skewed downside over the next week.  In particular, at the 3 day mark, which would be through Wednesday this week, there was about 7:1 MAX loss versus MAX gain.

So this would suggest that we are likely to see prices reach resistance here and have a modest sell off in the short term of the next week or so.


Each market environment is unique, and with prices turning parabolic to the upside for the last week, it sure doesn't FEEL like the downside risk is notably larger, but the combo of new price high with extreme complacency from the put/call measure has suggested that short term weakness is probable.

Thursday, May 18, 2017

1.5% Decline in SPY the Day After a 52 Week High - Bearish Implications for Coming Weeks

Click on Table to Enlarge

The above table shows instances in the history of SPY going back to 1995 where a 52 week high was followed the next day by a loss of greater than 1.5%, which is what we saw yesterday in SPY.  This filter also look for only times where there was MACD bearish divergence on the weekly chart at the 52 week high.

From the closing value of the day of the 52 week high, every single instance lost at least 4.8% over the next month of trading. 

Even taking out the filter of the bearish divergence on the weekly chart, the results were that 11 out of 12 previous instances declined at least 4.8% over the next month.

So this adds further weight to the outlook I posted earlier today based on the more subjective qualitative price pattern and a general view of conditions.

So given this back test, it is putting us on alert that stocks are likely to fall a few more percent in coming weeks.  And a few of the past instances led to sizable corrections of 10-20%

About half the past instances showed an approximate 1 week rally to back near the highs after the first 1-3 days of decline, before then selling off strongly again.

The other half of instances basically had no substantial bounce after the initial big down day.

If there are questions about how to make a trade with stops and limits here, comment.  But the idea is that after a little further decline over the next 1-2 days, stocks rebound for a few days, and that may be an ideal time to use an inverse ETF to try to capitalize on probable further sell off.


Pete