It seems apparent that there will be no real price movement in stocks until after some news events this week as far as elections and the FOMC meeting. I really don't see the elections as much of a market moving event unless the Constitution party wins a majority in both houses and in addition Obama decides to step down after it occurs because he can't work with people who are sticklers on the Constitution.
But I could see the FOMC verbiage about QE 2 lead to a significant price reaction. My belief based on technical analysis and sentiment analysis is that the market is set to make a swift retracement of recent gains, and possibly resumption of a longer term "secular bear market." So even if the announcement sounds good, it may get sold at least short-term.
Sunday, October 31, 2010

Thursday, October 28, 2010
RSI and Total Put/Call Ratio Divergence
The list of divergences in the current market are about maxed out. Just about every measure of market strength is showing bearish divergence. Let's look at a few more....
 Click on Chart to Enlarge
The total put/call ratio often diverges with price at market highs. It does often at lows also, but more so at larger degree lows. The chart above shows (in RED) times when the put/call ratio was starting to pick up even as prices moved higher. When this occurs noticeably within a wave up, it often results in a sharp correction. It also shows (in GREEN) times when the market was falling to new lows but the put/call ratio was not, indicating a lessening of fear and a change in underlying sentiment. Emotion/sentiment leads price. And price leads fundamentals. But everything known about the market boils down to one end result -- the market price. So price is the most important thing to study, but if you can find ways to measure the emotional component, you can then often be tipped off to when the emotional current is weakening, etc, and price should follow suit in the future.
 Click on Chart to Enlarge
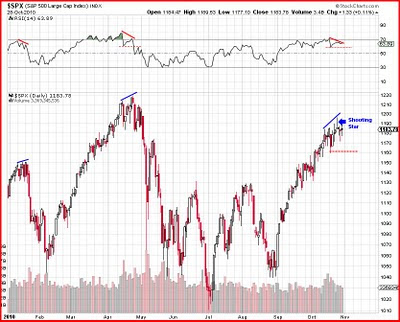
The RSI has formed a nice bearish divergence set-up on the major market averages. As the market have pushed higher the last week or so, the RSI has not, making a distinct lower peak. One way to use RSI to take a trade set-up like this, is to sell short when the RSI breaks below the most recent trough - in this case where I have the horizontal dashed line on the RSI chart.
The largest decline seen in this leg up in the S&P 500 has been 2.3%. So a 2.8% decline would be about 1.2 times as big as that. Assuming the highs on Monday are not exceeded, a 2.8% decline would put the S&P around 1162. So that is another sensible entry method for taking a short position in the market. In both cases the stop would go a tick/penny above the high for the rally.
Also note the shooting star candlestick on Monday which is a top reversal candlestick pattern. While there has been no follow through, we might be a little more forgiving given the upcoming events next week (FOMC and elections). It just seems that the market is not going to do much until then.
So to recap some of the last couple weeks posts and add some new info.....
1) There is bearish technical indicator divergence with price
2) There is bearish divergence in breadth (McClellan Osc, Adv/Dec, TICK, etc)
3) There is bearish divergence in volume (down vol, etc)
4) There is bearish divergence in the put/call data
5) There is bearish divergence in volatility (VIX)
6) There is bearish divergence in new highs-new lows
7) The S&P/Dow are not confirming new highs with the Nasdaq 100 which is a non-confirmation of sorts
Also of note is that the AAII survey is about as bullish as it has been in several years, which doesn't necessarily mean a major decline, but should indicate a pullback ahead at least.
So there is no question in my mind that the market is set-up to correct from here. Maybe it won't, but I think the odds of a "sell the news" type of response to upcoming news are a lot higher than a rally on the news.
 Click on Chart to Enlarge
The total put/call ratio often diverges with price at market highs. It does often at lows also, but more so at larger degree lows. The chart above shows (in RED) times when the put/call ratio was starting to pick up even as prices moved higher. When this occurs noticeably within a wave up, it often results in a sharp correction. It also shows (in GREEN) times when the market was falling to new lows but the put/call ratio was not, indicating a lessening of fear and a change in underlying sentiment. Emotion/sentiment leads price. And price leads fundamentals. But everything known about the market boils down to one end result -- the market price. So price is the most important thing to study, but if you can find ways to measure the emotional component, you can then often be tipped off to when the emotional current is weakening, etc, and price should follow suit in the future.
 Click on Chart to Enlarge
The RSI has formed a nice bearish divergence set-up on the major market averages. As the market have pushed higher the last week or so, the RSI has not, making a distinct lower peak. One way to use RSI to take a trade set-up like this, is to sell short when the RSI breaks below the most recent trough - in this case where I have the horizontal dashed line on the RSI chart.
The largest decline seen in this leg up in the S&P 500 has been 2.3%. So a 2.8% decline would be about 1.2 times as big as that. Assuming the highs on Monday are not exceeded, a 2.8% decline would put the S&P around 1162. So that is another sensible entry method for taking a short position in the market. In both cases the stop would go a tick/penny above the high for the rally.
Also note the shooting star candlestick on Monday which is a top reversal candlestick pattern. While there has been no follow through, we might be a little more forgiving given the upcoming events next week (FOMC and elections). It just seems that the market is not going to do much until then.
So to recap some of the last couple weeks posts and add some new info.....
1) There is bearish technical indicator divergence with price
2) There is bearish divergence in breadth (McClellan Osc, Adv/Dec, TICK, etc)
3) There is bearish divergence in volume (down vol, etc)
4) There is bearish divergence in the put/call data
5) There is bearish divergence in volatility (VIX)
6) There is bearish divergence in new highs-new lows
7) The S&P/Dow are not confirming new highs with the Nasdaq 100 which is a non-confirmation of sorts
Also of note is that the AAII survey is about as bullish as it has been in several years, which doesn't necessarily mean a major decline, but should indicate a pullback ahead at least.
So there is no question in my mind that the market is set-up to correct from here. Maybe it won't, but I think the odds of a "sell the news" type of response to upcoming news are a lot higher than a rally on the news.
 Click on Chart to Enlarge
The TLT ETF is showing a nice bullish divergence today on the 120 min chart above. If it moves higher then that would typically correspond with a move down in stocks.
Now longer term I think that bonds will fall, but the negative correlation has not really broken down yet between stocks and bonds. So in addition to the overvalued stock/bond ratio, this price pattern may suggest bonds move up from here (and stocks down probably). There is no confirmation of a move up yet though...I'm just noting the set-up right now.
Tuesday, October 26, 2010
TBT Follow Up (and More)
 Click on Chart to Enlarge
The stock to bond ratio on Sentimentrader.com is showing stocks overvalued relative to bonds currently. Typically stock will back off at extremes like this. With the overall correlations, it would be likely for bonds to rally during that time. Now I do believe that we will see most bonds fall if stocks correct, but usually the US Treasuries rally as stocks correct. That correlation has been weakening of late, but not enough that I think it makes a lot of sense to bet against bonds right now.
On that note, I am going to post an exit order on the TBT trade which is inverse to bonds.
Trade Action:
Place a GTC sell limit order at 34.42 for TBT.
 Click on Chart to Enlarge
The S&P 500 touched the 88.6% retracement yesterday and then reversed to form a shooting star candlestick. There was no downside follow through today, but with the time being stretched for this move, it may stick as a reversal. The gap at 1202 was not filled which leaves some upside chart headroom. Now the Dow 30 came within 10 point (a fraction of a percent) from the April high yesterday also before reversing to form a shooting star.
The gap yesterday had some characteristics of an exhaustion gap up. It was fairly large relative to the gaps in the trend, and it occurred on a notable news item (the G20 meeting announcement). So as long as Monday's highs hold, I respect it as a valid reversal.
One thing that has been missing that may be significant as a topping sign is that the OEX put/call ratio jumped to 1.51 today which is as high as it has been in a couple months. Remember that the OEX put/call ratio is typically a smart money indicator. So it usually jumps up near highs.
Friday, October 22, 2010
Waiting on the G20?
 Click on Chart to Enlarge
This chart here shows the VIX on the top and the NYSE down volume in the main pane. Both typically move inversely to stock prices. It is interesting to note that divergence appears at turning points in this chart. Even though volatility is languishing and the market is holding up or advancing, the down volume is starting to pick up. This likely indicates the early phase of selling into the highs by institutional players.
As a side note, the price range in the equity markets (and some others) was tiny today. It seems that the markets are awaiting something from the G20 meeting as far as currency policies go. Let me make it clear that the sentiment stage is set for a huge move up in the US Dollar relative to other currencies. So my assumption is that this will occur and use whatever spark necessary. I expect the US dollar to take off to the upside next week and stocks to start down. Keep in mind that the "currency wars" theme has been headline news everyday recently, it is the focus in the G20, and it made the cover of The Economist recently. Those are all signs that the current trend is ending. Think opposite the crowd.
Also, I will go into more detail on this later.......But if the market is topping out here and embarking on a significant decline, there should be high probability of large gap downs in this next leg down as it unfolds, and probably a swoon event more severe than any seen in the last couple years.
My suggestion on an investment basis is to be 100% out of stocks. The best buy opportunity I think is the US Dollar. I also believe natural gas will probably be a good investment play at these levels. It seems to me that the carry trade is largely responsible or at least correlated with the natural gas decline. So when the carry trade gets unwound and the US Dollar rises, I think natural gas will too. Stay away from gold now as well too. It is way overbought and may be set for a much larger decline than the recent pullbacks over the last year or two.
Thursday, October 21, 2010
SPX Update
 Click on Chart to Enlarge
There are several things today that suggest maintaining a stance that a market high is imminent is sensible. The chart above shows a compelling time relationship in that on Monday the advance since July will be 1.618 time as long as the fall from April to July, AND the time of the current leg up will be equal to the time of the last two "waves" (early July to early Sept). So maybe this week is it as far as the advance goes.
Now the Dow 30 is very close to the April highs. It is only about 0.5% shy. A nice topping scenario may be for it to double top today or tomorrow, while the S&P still lags below the April highs.
There are several little non-confirmations or divergences happening today to that suggest the rally is ending. Neither gold nor silver nor the Euro are making new highs this morning while stocks are. Given the correlations and % declines, it looks like those markets may have already topped, and that this is a last gasp in stocks. Also the VIX is not making new lows compared to last week. That has often happened at the end of a leg up in stocks as sell.
Subscribe to:
Posts (Atom)