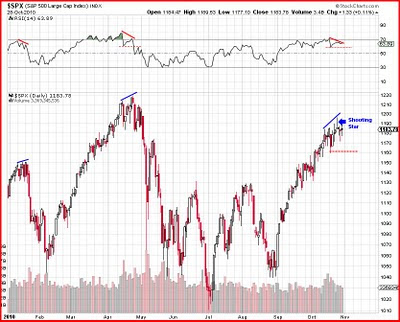
The list of divergences in the current market are about maxed out. Just about every measure of market strength is showing bearish divergence. Let's look at a few more....
The total put/call ratio often diverges with price at market highs. It does often at lows also, but more so at larger degree lows. The chart above shows (in RED) times when the put/call ratio was starting to pick up even as prices moved higher. When this occurs noticeably within a wave up, it often results in a sharp correction. It also shows (in GREEN) times when the market was falling to new lows but the put/call ratio was not, indicating a lessening of fear and a change in underlying sentiment. Emotion/sentiment leads price. And price leads fundamentals. But everything known about the market boils down to one end result -- the market price. So price is the most important thing to study, but if you can find ways to measure the emotional component, you can then often be tipped off to when the emotional current is weakening, etc, and price should follow suit in the future.
The RSI has formed a nice bearish divergence set-up on the major market averages. As the market have pushed higher the last week or so, the RSI has not, making a distinct lower peak. One way to use RSI to take a trade set-up like this, is to sell short when the RSI breaks below the most recent trough - in this case where I have the horizontal dashed line on the RSI chart.
The largest decline seen in this leg up in the S&P 500 has been 2.3%. So a 2.8% decline would be about 1.2 times as big as that. Assuming the highs on Monday are not exceeded, a 2.8% decline would put the S&P around 1162. So that is another sensible entry method for taking a short position in the market. In both cases the stop would go a tick/penny above the high for the rally.
Also note the shooting star candlestick on Monday which is a top reversal candlestick pattern. While there has been no follow through, we might be a little more forgiving given the upcoming events next week (FOMC and elections). It just seems that the market is not going to do much until then.
So to recap some of the last couple weeks posts and add some new info.....
1) There is bearish technical indicator divergence with price
2) There is bearish divergence in breadth (McClellan Osc, Adv/Dec, TICK, etc)
3) There is bearish divergence in volume (down vol, etc)
4) There is bearish divergence in the put/call data
5) There is bearish divergence in volatility (VIX)
6) There is bearish divergence in new highs-new lows
7) The S&P/Dow are not confirming new highs with the Nasdaq 100 which is a non-confirmation of sorts
Also of note is that the AAII survey is about as bullish as it has been in several years, which doesn't necessarily mean a major decline, but should indicate a pullback ahead at least.
So there is no question in my mind that the market is set-up to correct from here. Maybe it won't, but I think the odds of a "sell the news" type of response to upcoming news are a lot higher than a rally on the news.
Subscribe to:
Post Comments (Atom)


No comments:
Post a Comment