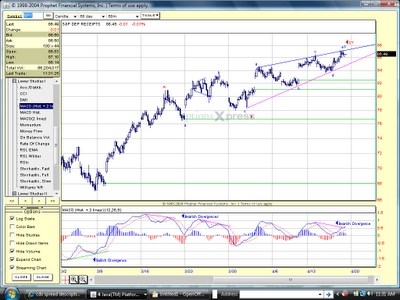
There's not a lot new to cover today that I haven't gone over in recent days as far as analyzing market sentiment. In my mind, everything is set for a decline on that front by comparison to past bear market highs (or even first legs up in a bull market for that matter). So today I am just going to show my analysis on the SPY chart and what has to happen to validate the pattern suggested there. First notice the divergence in the MACD as price has made new highs. While there has not been a bearish cross on the MACD yet, if there is, it is suggestive of at least a short-term top. Look back at the other divergences on the chart both bullish and bearish to note how effective such a signal has been for short-term pullbacks.
Also, from a pattern standpoint I have labeled this such that the last couple weeks is forming a contracting triangle in the form of a rising wedge. If that is indeed the case, then the market must move all the way back down to the 78.00 level in the next 2 weeks or less to confirm the possibility that a contracting triangle completed. Also, upside is very limited in this case as the "e" wave must be shorter than the "c" wave. Basically, we have to see some downward price movement the beginning of next week for this to be correct. If we don't, I will be much quicker than normal to suggest a stop placement or outright exit of BGZ because this is still a counter trend trade until proven otherwise.
Now I wanted to just to take a look at a relatively new indicator that has just pushed into extreme territory the last day or so. The top black line is the S&P 500. The blue line is an index called the Credit Default Swap (CDS) Index. And the bottom line is a stochastic oscillator of the CDS. For a little education on this index since it is a little more exotic than most indicators, I will briefly exlain the idea behind this.
One route of investing is to buy debt. This is like a bond, which is debt that someone has and agrees to pay the investor some yield. While some of this debt is high quality, some is not. Hence junk bonds, etc. The credit default swap market is a market where someone who is invested in a debt instrument, like a junk bond, can buy a default swap that is like insurance in case of default by the debt issuer. The seller of the swap will receive the premium but is also risking having to pay the buyer the value of the swap if the issuer defaults. That is the basic concept of default swaps.
The other concept to grasp is that some debt is riskier than others and the investor will be willing to pay more for the default swap. So junk bonds will be more risky than government issued debt like treasury notes, etc. So that brings us to the CDS Index which measures the difference or spread between the credit default swaps on junk bonds and treasuries. When investors are fearful of financial demise the spread will widen. When things seems safe, the spread will tighten.
The reason I am showing this indicator is because I think it will be an important one for a while due to the state of our financial system. What we are seeing now is that spreads have tightened considerably in the last few weeks and the stochastics is in danger territory. So we now have another indicator from an entirely different type of data than I've shown recently suggesting complacency/(over?)confidence in the market.
So the bearish case is becoming more compelling by the day, yet the most important part of the case from a trading perspective is price confirmation which we have not seen yet. Because of that, any blog followers will need to be sure to follow whatever protective measures are suggested in coming days on the open BGZ trade.
Pete


No comments:
Post a Comment