Wednesday, November 30, 2011

Click on Chart to Enlarge

The VIX touched its lower bollinger band today indicating that this reaction rally could possible stall out soon.  Each time over most of the last year, when the VIX touched the lower band, the market soon topped out and corrected.  The red lines show the last times when the VIX touched the lower band.  Also the bands are not currently in a trending type configuration, so I don't presume that it will trend lower, though that could develop.

An interesting thing in the VIX today is the market made nice open to close gains and was up huge.  However the VIX was down relatively modest compared to normal correlations.  Also the VIX actually closed up from the open, which bucks the typical trend in the VIX which is inverse to the SPY/SPX.  So I don't know exactly what this means, but it is a little odd for a typical market rally.  I take it as a sign that the psychology is not in bull mode at this time at least.  It looks a bit more like a bear market rally.


Click on Chart to Enlarge

A couple things to note here on SPY.  First off the big gap down from last week has now been filled which could allow the market to top and continue lower in a downtrend.  However, the gap was closed in a major way, and the market did not find any resistance there, so it may not be a factor for capping this reaction rally.

On another note, when a triangle forms at the end of a correction as I have labeled above, there will often be a reaction rally back toward the apex of the triangle after the initial breakout.  We may be seeing that here.   Tomorrow is the apex of that triangle.

Obviously these huge gains seem extremely bullish, and it may well be that.  But most of these huge gaps up on news/etc that I can ever recall seeing are in bear market rallies.  In any case, as I have posted previously, it would be more typical for the time frame of a normal bear market rally for the market to push to a new rally high before topping.  So that wouldn't even really negate a possible bear market environment.

I don't have a great take on this right now as far as what to expect.  But there are a few things I have mentioned here and looked at that would suggest if this is a bear market rally, it should be done in the next day or two.


Monday, November 28, 2011

What Today's Big Gap Up Means

Quantifiable Edges put a brief post today showing performance of SPY from open to close when it closed at a 20 day low yesterday and then gapped up 2% or more the next day.  Since 2003 there have only been 6 instances.  Most of them occurred in the context of the 2007-2009 bear market.  All but one led to lower lows not long afterward.  The one that didn't was on March 10th 2009 coming off the 2009 bear market low, the day after the closing low on March 9th.

Here is the take home.  The day of the gap up has consistently seen continued gains from open to close.  So expect today to be generally up.  The next day had a higher high in every case with almost all of them gapping up the next day as well.  However, most of them closed down the day afterward (which would be tomorrow in our case).  The two that didn't close down the following day were the March 10th one which obviously kicked off a bull market.  Also, the Nov 21st 2008 instance continued up the next day and led to a 5-6 week bear market rally.  The other 4 instances topped soon afterward 1 day, 1 day, 5 day, and 3 days later respectively.

In our current market, there is an unfilled large gap down from last week at 121.98 on SPY.  That is still a couple percent above current prices.  So here is what may be the most likely scenario......A continued move up today, and some further upside tomorrow to fill that gap down....then possibly a move to new corrective lows below last week's lows.

The Nov 21st 2008 instance rallied in typical seasonal fashion until the new year, before continuing to decline.  The seasonal tendency is so strong this time of year that maybe we should expect that this time around as well.  However, the market seems to me to be in a significantly different context when looking at the technical analysis and also from a qualitative standpoint.  In our case the weekly stochastics has just turned down from overbought.  5 out of the prior 6 instance occurred with the market coming off very oversold conditions as far as weekly stochastics.  The incident after the flash crash was shortly after an overbought stochastics.

So, my expectation is for most likely continued downside below last week's low.  However, possibly we may rally toward's year end.


Saturday, November 26, 2011

Intermediate Term Top and Bull Market High Confirmed in SPX?

Click on Charts to Enlarge

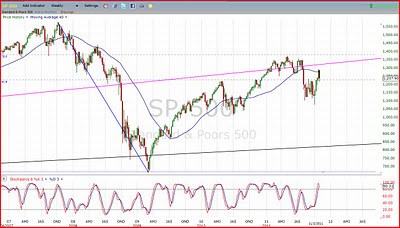
The weekly stochastic indicator (14,3,3) made a bearish cross this week after a sharp rally in the index up to the 200 day SMA.  This is very similar to what occurred in 2008 into the May 2008 high.  Check out the two pink arrows on the chart.  This is a technical analysis signal that confirms this rally is likely complete.

The lower of the two charts above shows with vertical lines where the SPX was in the past when the monthly 14,3,3 stochastics crossed from above 50 to below 50 (both the %K and %D).  Both confirmed bull market tops were completed.

On a multiple time frame momentum perspective here is where we are:

-monthly neutral and trending down
-weekly overbought and just turning down
-daily oversold

So the market is probably due for a brief rally soon, but the larger momentum currents appear to be down.  


Wednesday, November 23, 2011

SDS Exit

The SDS trade was exited at 22.55 on the open this morning.

There is still downside potential for stocks, but the large unfilled gap up at the 61.8% retracement of the Oct rally is just under prices, and the market could find support and bounce there.  At this point I am not really looking to try to catch a bottom here, but if a nice looking bullish reversal occurs, I may consider a bullish trade if the market forms a higher swing low on the chart.

Tuesday, November 22, 2011

Limit Order to Exit SDS

Place a "day only" limit order to sell the open SDS trade tomorrow at 22.14 or better. 

As long as there is not an unfilled gap up tomorrow, it will be filled.  If there is a big gap up, then the market should push to fill Monday's gap down.  In that case I don't think the market will be able to continue up without a retest of these lows at least, because the upper bollinger band is still moving upward and the volatility breakout is not complete.  If that gap is filled, then after that another break to new lows for the correction could get more severe.  As long as both the upper and lower bollinger bands are expanding away from each other, the market often experiences rather violent moves in the direction of the trend.  In this case, until the top band rolls over, there could be increasingly large downward moves.  However, the expansion in QQQ is already at 4 days, and on average the expansion period doesn't last much longer than that. 

Also, gold is in a precarious position hovering just above its bull market trendline and just above the lower bollinger band.  It touched the lower band yesterday.  I will try to get into more detail on this concept as time allows, but IF the market breaks to a new low after a brief reversal off the lower band, the bottom will often fall out of the market.  It think that may happen here in gold, and possibly in stocks as well.


Thursday, November 17, 2011

SPY Pattern Update

Click on Chart to Enlarge

The chart above has an updated wave labeling on SPY. It looks most likely to me that this rally is now complete. However, if it is not then I expect a push to new highs over the next 2 weeks.

The reason I believe the rally may be complete is due to pattern and the bollinger bands. The data I recently showed would suggest that a new high is likely on the rally based on time averages. That has to be used as a guideline, but it's not set in stone.

Many chart analysts have noted the symmetrical triangle that formed in SPY over the last few weeks. Many expected it to break to the upside. I have noted in the past how complex corrections often END with contracting triangles, and that often throws people off on the direction of the breakout. That is what I believe is happening here. It looks to me like a w-x-y pattern ending with the "y" pattern as a contracting triangle. A triangle would not be expected to form in the "y" position if a "z" were to follow. The triangle is the typical ending pattern. By that logic, this suggests the current rally in stocks may be over.

I noted earlier today that the QQQ made a downside breakout of its bollinger bands. It did close beneath the lower band today, which is good confirmation of a new trend. I would expect the market to continue in the downward direction in this case.

On the other hand, the bollinger bands on SPY contracted slightly today, and the market touched the lower band, but it closed up slightly from the lows. So the jury is out on this one. A gap down and low close tomorrow, below the lower band, would be great further confirmation that the broad market is likely turning lower.

My take is to maintain the view that this is a bear market rally in stocks that is topping, and that commodities are going to continue down as well. Check out the USO etf. Oil put in a confirmed doji topping candlestick. Oil has been propping up the commodity indexes, so a top in oil will likely weigh heavily on commodity/energy stocks and the commodity indexes.

Possible Breakdown on QQQ

Click on Chart to Enlarge

As I mentioned in the post last night, be looking for a breakout move on QQQ. While the day is still young today, if it closes where it is now it will be a great breakdown. The bollinger bands are expanding today which you want for a true volatility breakout. The market gapped in the direction of the breakout which is also good in this case. And a long bar from open to close (a long red bar in this case) is also good. If the market closes below the lower bollinger band today, then shorts can be entered with a stop one penny above today's high. Then don't exit until the bottom band inflects back up.

Now the hourly chart is oversold on the oscillators, so I would suggest waiting until just before the close to enter a trade to make sure not to get caught at a reversal at the lower band. Remember that average bear market rally would still have about 2 weeks to go before a high, so it is possible we touch down here, then start to rally for another week or so.

Wednesday, November 16, 2011

QQQ Waiting on a Breakout Move

Click on Chart to Enlarge

See the chart above for some notes. I think that this market is set up for a major move, most likely down from these levels. You don't often see a 7 reading on the daily ADX. That indicates a period of extreme trendlessness. Those periods can be followed by extremely sharp a large market moves. My belief from the overall context is that this next move will be down, and could be very large. The average bear market leg down is about 26% down. It is possible with such a low ADX that this leg could be larger.

Tuesday, November 15, 2011

Gold Update

Click on Chart to Enlarge

This chart is continuous gold prices. For reasons I have covered in detail in recent months, I fully expect the decline off the September high in gold to be the initial leg down of a bear market in gold. I also believe this is likely a long term top in gold based on long term price channels and the overall market context. I have recently posted an inverse ETF trade on gold to make gains as gold falls. The chart above shows (in green) the average 1st bear market rally in gold after a first leg down. The blue line is the projection from the Sept 2011 low of the 2008 first bear market rally. Both project to the first week of December. Recall from my prior post that the average bear market rally in stocks since 2000 projects to the first week of Dec also.

In both cases the current market has already exceeded the average price retracement or percent gain up from the lows, but the time is a bit shorter than typical. So I feel confident that this template is a good one for the current market environment. Both market could peak any time now if they haven't already, and upside is likely limited on an push to new rally highs. It seems likely that both stocks and gold peak around the same time on this rally, and both correct together. I personally believe both will go to new lows below the Sept/Oct lows.

Markets will likely continue to fall in a deflationary theme with most markets down and the US dollar up as ongoing debt problems come into crisis. On a long term investment basis I would be long the US Dollar UUP etf and in virtually nothing else.

Sunday, November 13, 2011

Detailed Historical Projections for the S&P 500

Click on Chart to Enlarge

See chart for details. The red rectangle is the expected price/time range for a bear market rally to top based on 2000-2009 comparisons. The green solid line is the average. Our market has already reached the average price gain. However, it would be more typical for the market to burn some more time, and make another minimal high above the Oct 27th high.

Click on Chart to Enlarge

The average bear market leg down since 2000 has been 110 days and about -26%. In this chart above I have projected that down from the end of the previously shown average bear market rally which is projected to end the first week of December. That would put the S&P 500 at 954 by the end of March. So we could look at Q1 expiration put options on the S&P 500 on a push to new rally highs over the coming weeks. The blue line I have shown in the prior post, which would be the typical bull market leg up.

Click on Chart to Enlarge

This chart shows some chart resistance lines with 1295 being the main overhead resistance that I think is of significance. The vertical lines show the upcoming Fibonacci time relations of the May-Oct decline projected out from the Oct 4th low.

The closest analog to the leg down from May-Oct is the 1st leg down in 2007-2008. The bear market rally to follow topped at a 0.40 time ratio which is an approximate 0.382 time ratio. That is where I think the most likely topping range is in our market. That would put us into the 1st week of December.

Friday, November 11, 2011

Pullback or Consolidation Likely to Continue in Stocks

Click on Chart to Enlarge

The market has run up extremely fast over the last month. If you look at the numbers I showed on the bear market rallies in the last 2 bear markets you see that, and on the chart above the blue line shows a typical bull market rally/leg up. The market has greatly exceeded that rate of gain initially, so even if stocks continue to trend up, consolidation is very likely.

Thursday, November 10, 2011

Quick Note

I believe that the markets are setting up for a very sharp move very soon. I expect it to be down. On a purely objective basis check out the DMI/ADX on the QQQ etf. The ADX is at a multi year low as the market is chopping around the top of the last year's range. Also, the ADX has been in a trendless mode for an extended period of time. As I mentioned in some greater detail a couple months back in relation to silver and the US Dollar, an extended trendless period is a basing/consolidation before another large move in the markets.

Also, check out the daily bollinger band configuration on the QQQ. Price has traded in a tight range for the last month, hanging out just above the 200 day SMA. The bands are now squeezed together which is setting up a breakout type move. So far today, the lower band has started to point down while the upper has pointed slightly up from yesterday. This is an indication of volatility expansion, and since price is going down, it is possibly a clue that the next move will be down. The most volatile moves will begin after a band squeeze with the bands suddenly separating sharply and the market closes outside the bands. The duration is always in question but my experience would say that the longer and choppier the trendless environment before the breakout, the sharper and larger the breakout move will be.

So, keep an eye on the bands over the next several days or weeks.

Wednesday, November 9, 2011

SPY Pattern Projection

Click on Chart to Enlarge

After the brief 2-3 day decline from the Oct 27th high, SPY has rallied to a lower high over 5 days time. This makes the downward move more powerful and suggests that the market may move lower without toward last week's low before breaking the Oct 27th high. So the short term price logic is down. We are seeing about a 2% decline in the premarket futures right now, so a large gap down here will likely kick off a move that I would project should approximate the pink projection line as a normal mild bearish scenario. That would be typical for a "flat" abc correction off the Oct. 27th high.

Now, 2% gaps down are very often filled rather quickly, let's say within the next week or so. So, we may still see new highs for the rally or some chop at these levels if the market does come back and fill the gap down.

My plan is to exit the open SDS trade at the next oversold signal on 60 min stochastics.

Brief Note Regarding GLL

FYI, gold is down about 0.7% in the pre-market, so the GLL ETF would gap up about 1.5% since it is a 2x inverse ETF. So you could keep an eye on if this changes before the market open to calculate position size. But I would use 15.75 as the approximate opening price at this time. The stop will still be 14.25. So the risk per share is $1.50.

The conventional wisdom on position sizing is to risk 2% of trading account or less per trade. There is a precise way to calculate exactly how much to risk, but one has to know win rates and average winner vs loser stats to do that.

Tuesday, November 8, 2011

New Trade - GLL

Click on Chart to Enlarge

Buy GLL tomorrow with a GTC sell stop @ 14.25. Current price is 15.56, so that could be used to calculate position size.

GLL is a 2X inverse gold ETF. Gold is right in the target area for a 1st reaction rally high after a bull market high. This is typically the best time to short a market. The time frame for a high may still allow several days or more, but there is bearish divergence on the hourly chart and the daily stochastics is overbought, so I don't feel compelled to wait any longer.

I also am buying Jan 2012 52 puts on GDX at the open tomorrow. GDX is the gold miners ETF.

Thursday, November 3, 2011

Legs Down in the Last Two Bear Markets

2000-2002
-14.3% in 20 days
-18.4% in 111 days
-22% in 50 days
-29% in 122 days
-34.1% in 230 days
-20.7% in 49 days

2007-2009
-20% in 158 days
-48.6% in 186 days
-29% in 60 days

These are the legs down in the last 2 bear markets. A leg down is defined as any move down that does not have a 1 month (or more) low to high correction against the downward trend.

Notice that the typical leg down has been 2-5 months. Now when looking at bull market corrections they are more commonly 4-6 weeks in duration before a corrective low. So if the market is making a high in this area, then we may expect a downtrending move over the next 4 weeks or more.

Wednesday, November 2, 2011

Market Update

Click on Chart to Enlarge

This chart is a daily SPY chart with a standard 14,3,3 stochastics setting for overbought/oversold. It has just made a bearish cross and trailing 1 bar low sell signal. So there is potential for some selling to follow-through at this time. Also, the decline off the recent high has been larger than any since Oct 4th, so there is an indication that the uptrend so far is likely being corrected on this move. The bollinger bands are now narrowing suggesting a consolidation in effect. Based off of past similar band patterns, I think that a test of the lower band is likely especially if the 20 day SMA is penetrated.

I have posted a GTC sell stop at 19.02 on the open SDS trade at this point. We now have a legitimate stochastics sell signal, so at this point I want to watch the hourly chart for an exit to this trade. I am thinking this may end up as a small loss or small gain by the time the signal comes.

Click on Chart to Enlarge

This is a potentially powerful set up for a downside move. The weekly SPX chart with an 8,3,3 stochastics setting is now overbought and starting to roll over. So given the daily chart overbought momentum AND weekly overbought momentum at a LOWER high, the technical analysis is set-up for a possible significant downside move. Also, the market has come back down hard below the 200 day SMA after a brief foray above it. Again, this MA is often a support/resistance area. I believe that trading algorithms get triggered around the 200 day MA which creates "noise" around the MA before the trend reverses or re-establishes.

I am thinking late November may be the next time frame for a significant market inflection point based off of the time of past downward cycles in recent years. If this is indeed a bear market environment, then I would say mid to late December would be a more likely target date, assuming we are seeing an intermediate term high at the current time frame.

Tuesday, November 1, 2011

EUO Stopped Out

The EUO trade entered 9-1-11 was stopped out at breakeven (17.17) last week on 10-27-11. I did not expect such a deep retracement of the breakout move. I will monitor this one for a possible re-entry.