Wednesday, November 2, 2011
Market Update
This chart is a daily SPY chart with a standard 14,3,3 stochastics setting for overbought/oversold. It has just made a bearish cross and trailing 1 bar low sell signal. So there is potential for some selling to follow-through at this time. Also, the decline off the recent high has been larger than any since Oct 4th, so there is an indication that the uptrend so far is likely being corrected on this move. The bollinger bands are now narrowing suggesting a consolidation in effect. Based off of past similar band patterns, I think that a test of the lower band is likely especially if the 20 day SMA is penetrated.
I have posted a GTC sell stop at 19.02 on the open SDS trade at this point. We now have a legitimate stochastics sell signal, so at this point I want to watch the hourly chart for an exit to this trade. I am thinking this may end up as a small loss or small gain by the time the signal comes.
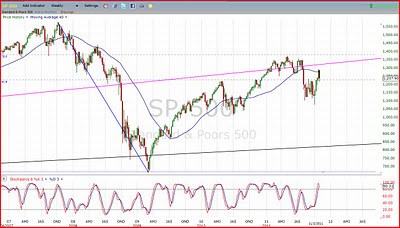
This is a potentially powerful set up for a downside move. The weekly SPX chart with an 8,3,3 stochastics setting is now overbought and starting to roll over. So given the daily chart overbought momentum AND weekly overbought momentum at a LOWER high, the technical analysis is set-up for a possible significant downside move. Also, the market has come back down hard below the 200 day SMA after a brief foray above it. Again, this MA is often a support/resistance area. I believe that trading algorithms get triggered around the 200 day MA which creates "noise" around the MA before the trend reverses or re-establishes.
I am thinking late November may be the next time frame for a significant market inflection point based off of the time of past downward cycles in recent years. If this is indeed a bear market environment, then I would say mid to late December would be a more likely target date, assuming we are seeing an intermediate term high at the current time frame.
Subscribe to:
Post Comments (Atom)


No comments:
Post a Comment